Purpose
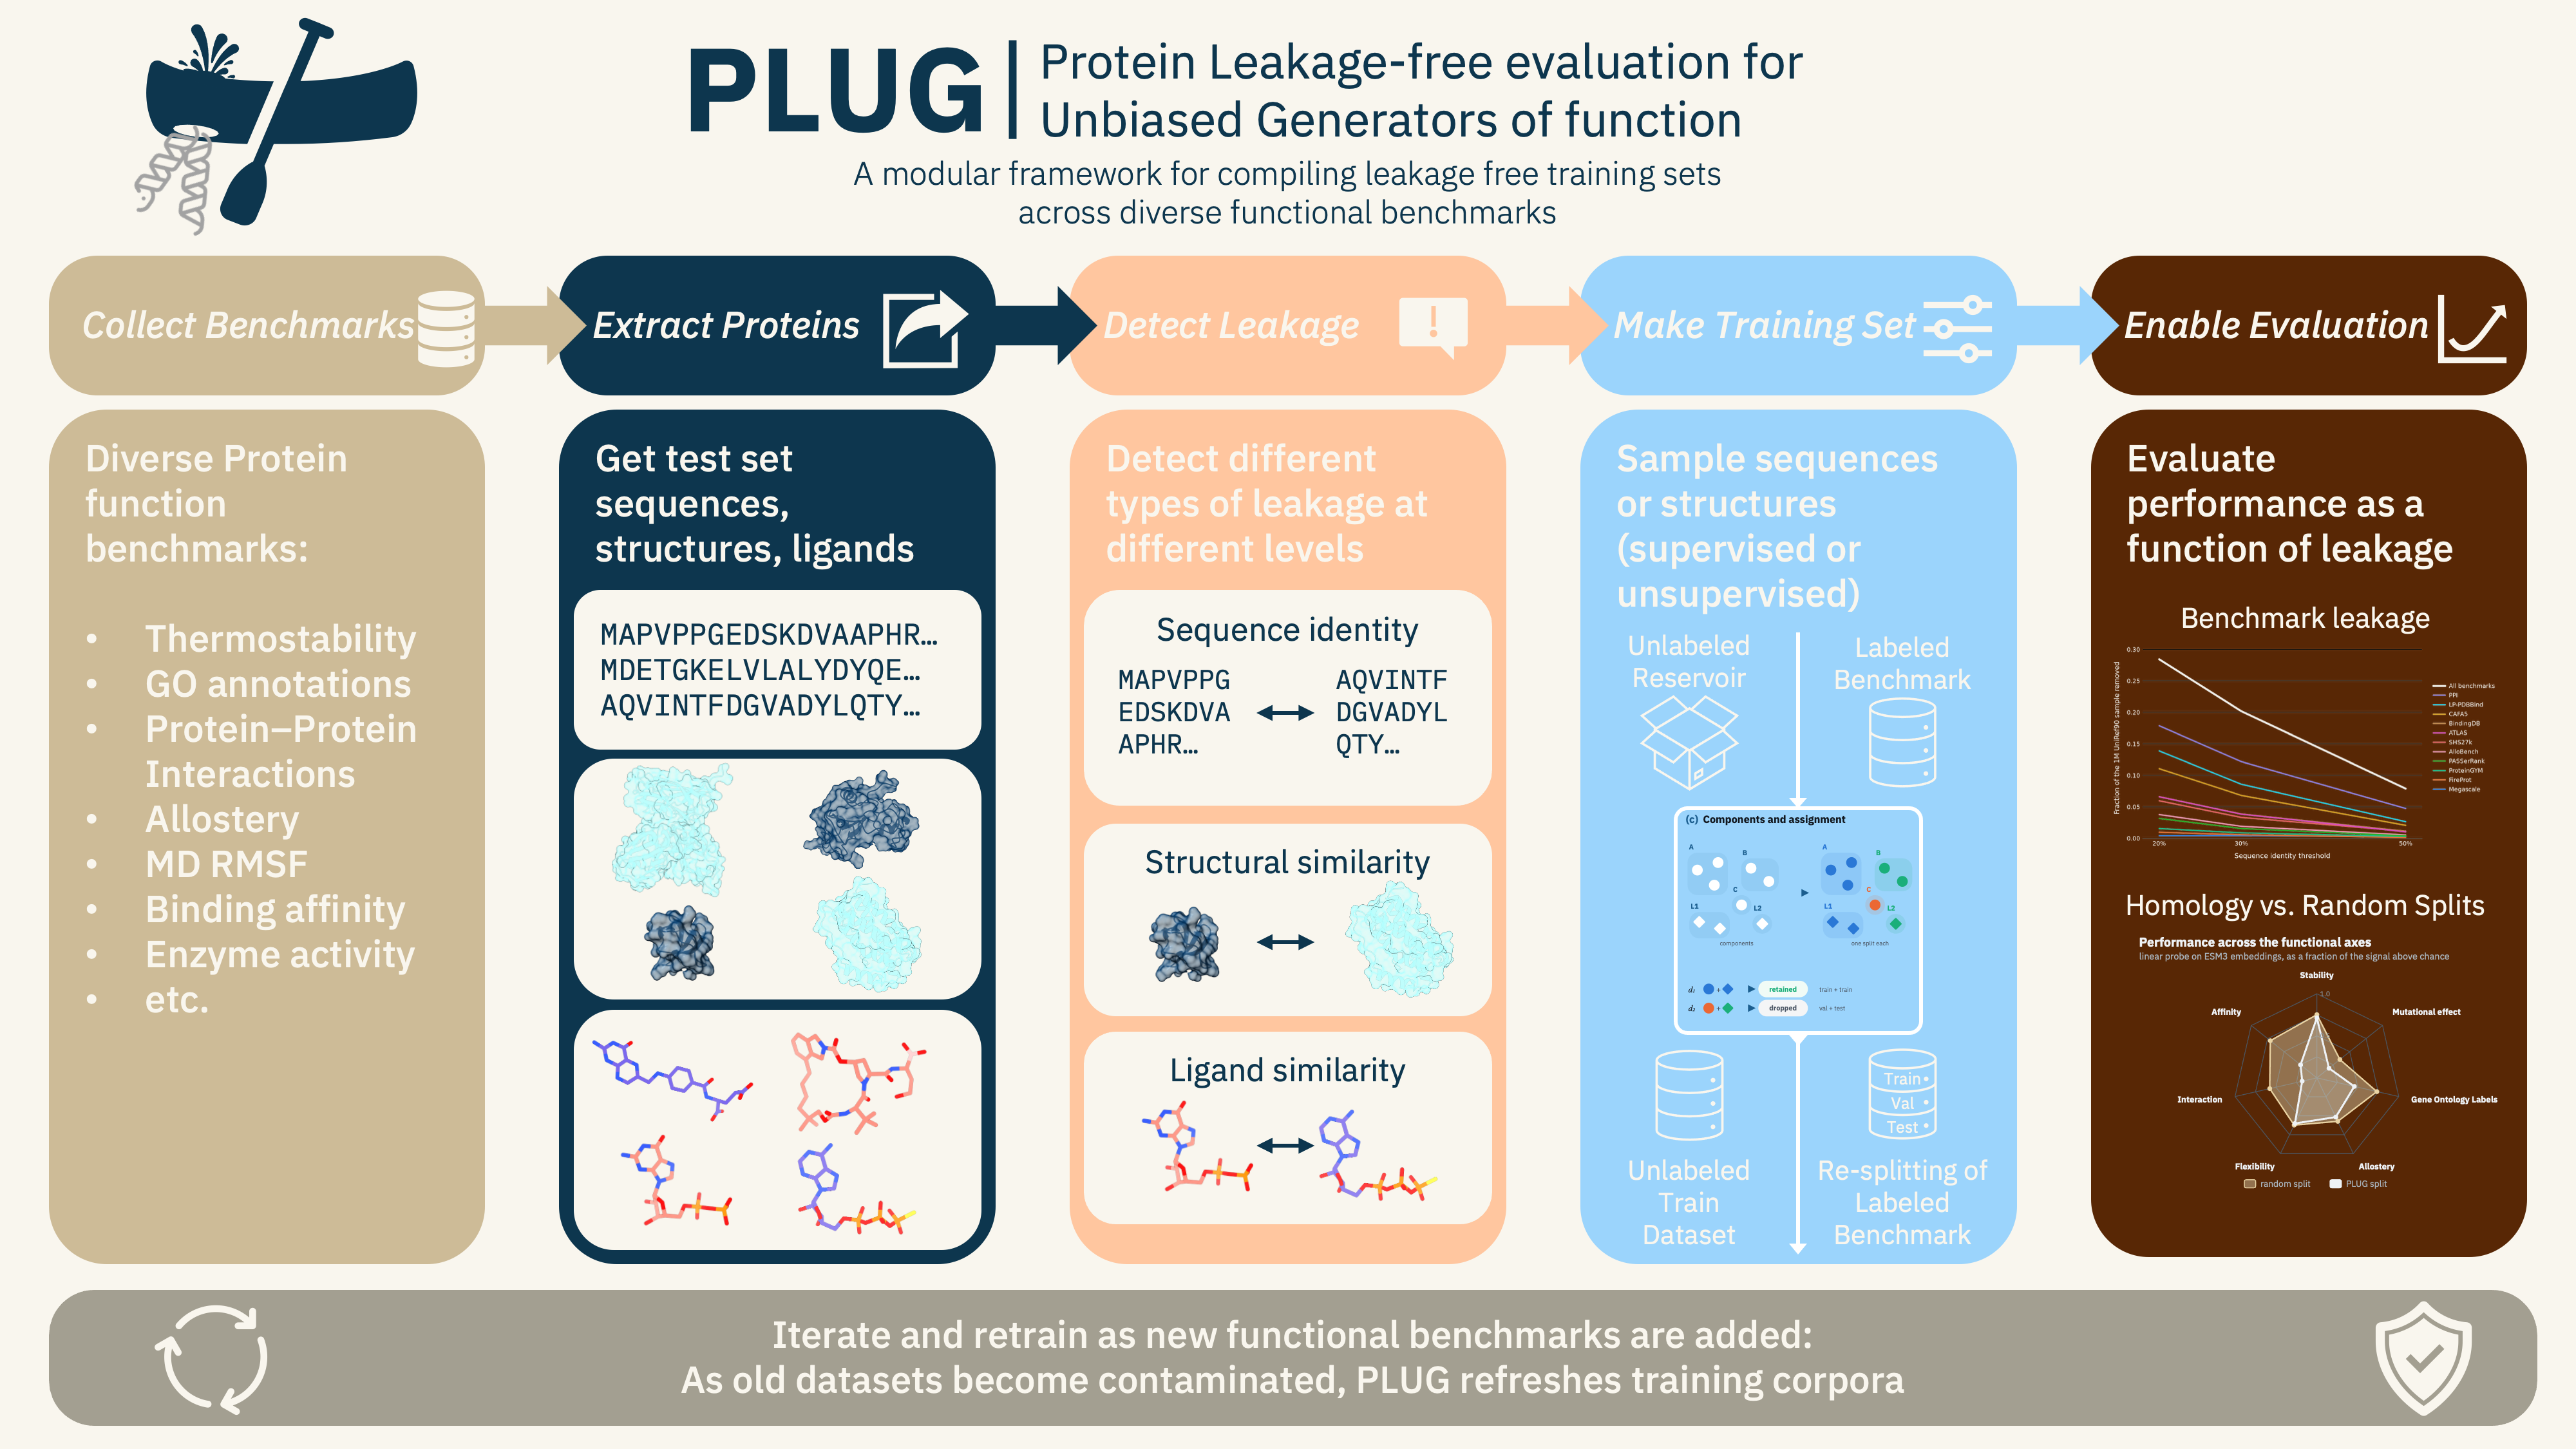
Protein function is inherently multidimensional. Proteins perform an extraordinary range of biological functions, from catalysis to molecular recognition. These functions depend on local features like active-site chemistry, on long-range effects like allostery, and on interactions with other molecules. If a model has learned protein function in general, its predictions should transfer across functional properties. However, current benchmarks usually score a single or pooled functional property, obscuring which aspects of function models actually capture. Further, these benchmarks employ various data splitting strategies, making it difficult to evaluate across benchmarks without incurring data leakage. Here, we introduce Protein Leakage-free evaluation of Unbiased Generators of function (PLUG), a modular and extensible framework for leakage-free evaluation of prediction models across multiple functional properties. Taking multiple different benchmarking datasets, PLUG constructs test sets that are controlled for homology across datasets. A user can fix the test sets and generate an unlabeled training set or partition the data into homology-aware splits for supervised and transfer learning. PLUG is also designed to easily incorporate new functional datasets, and allow users to design their own splitting strategies across existing and proprietary datasets. We show a substantial performance gap between splits controlled for homology and random splits over the same data in PLUG demonstrating that leakage-free evaluation is essential for measuring whether models capture general principles of protein function. To facilitate community engagement we developed a Hugging Face portal to track evaluations of multifunctional protein prediction models. Predictions can be submitted to a running leaderboard and model performance is evaluated on each dataset separately as well as the benchmark as a whole.
Introduction
Predicting protein functions and how they change under perturbation is a central goal of biology. 1–3 Protein function is inherently multidimensional. A single protein can perform myriad biological functions such as catalyzing reactions, binding ligands, and signaling allosterically. 4–8 The impact of each function can change with small perturbations, such as a macromolecular interaction, a mutation, or a post-translational modification. Together, this concert of functions is essential for all biological processes. The space of possible sequences for a single protein is vast (), with perturbations on top of this, making exhaustive experimental characterization impractical. Accurate prediction of protein function would enable interpretation of the millions of unlabeled protein sequences, understanding the impact of mutations, and designing for function.
To date, over 300 million protein sequences have been cataloged; 9–10 however, fewer than 1% are functionally characterized. 11–12 One challenge of mapping sequence to function is that protein function spans many levels of granularity. At the broadest level, Gene Ontology (GO) terms classify whole proteins by molecular function, biological process, or subcellular localization and have been instrumental in organizing the deluge of sequencing data by identifying key pathways. 3, 13 Similarly, Enzyme Commission (EC) numbers assign a sequence indicating its relationship to known enzymatic activities. GO terms and EC numbers are often assigned by guilt-by-association or sequence similarity, an approach now being extended through learned representations rather than alignment alone. 14 These methods are scalable but only coarsely describe function and can be agnostic to finer mechanistic details. Further, sequences with unrelated folds but convergent function remain a persistent blind spot and still require biochemical or cellular characterization for accurate annotation. 15
Consider thrombin. At the GO level, it is a serine-type endopeptidase and a key member of the coagulation cascade. A His-Asp-Ser catalytic triad places it in the chymotrypsin-like S1 family, alongside coagulation factor Xa and the digestive enzymes trypsin and chymotrypsin. 16 These proteins share the same fold, the same catalytic mechanism, and broadly conserved activity. Yet this shared annotation obscures finer mechanistic detail 17–18. A single mutation may leave thrombin's proteolytic activity intact while rewiring allosteric communication, driving aberrant downstream signaling. Other mutations may change the proteolytic specificity of thrombin while having minimal impact on the catalytic activity. 19 Untangling these effects is required to predict mutational consequences, design better therapeutics, and engineer proteins with novel properties.
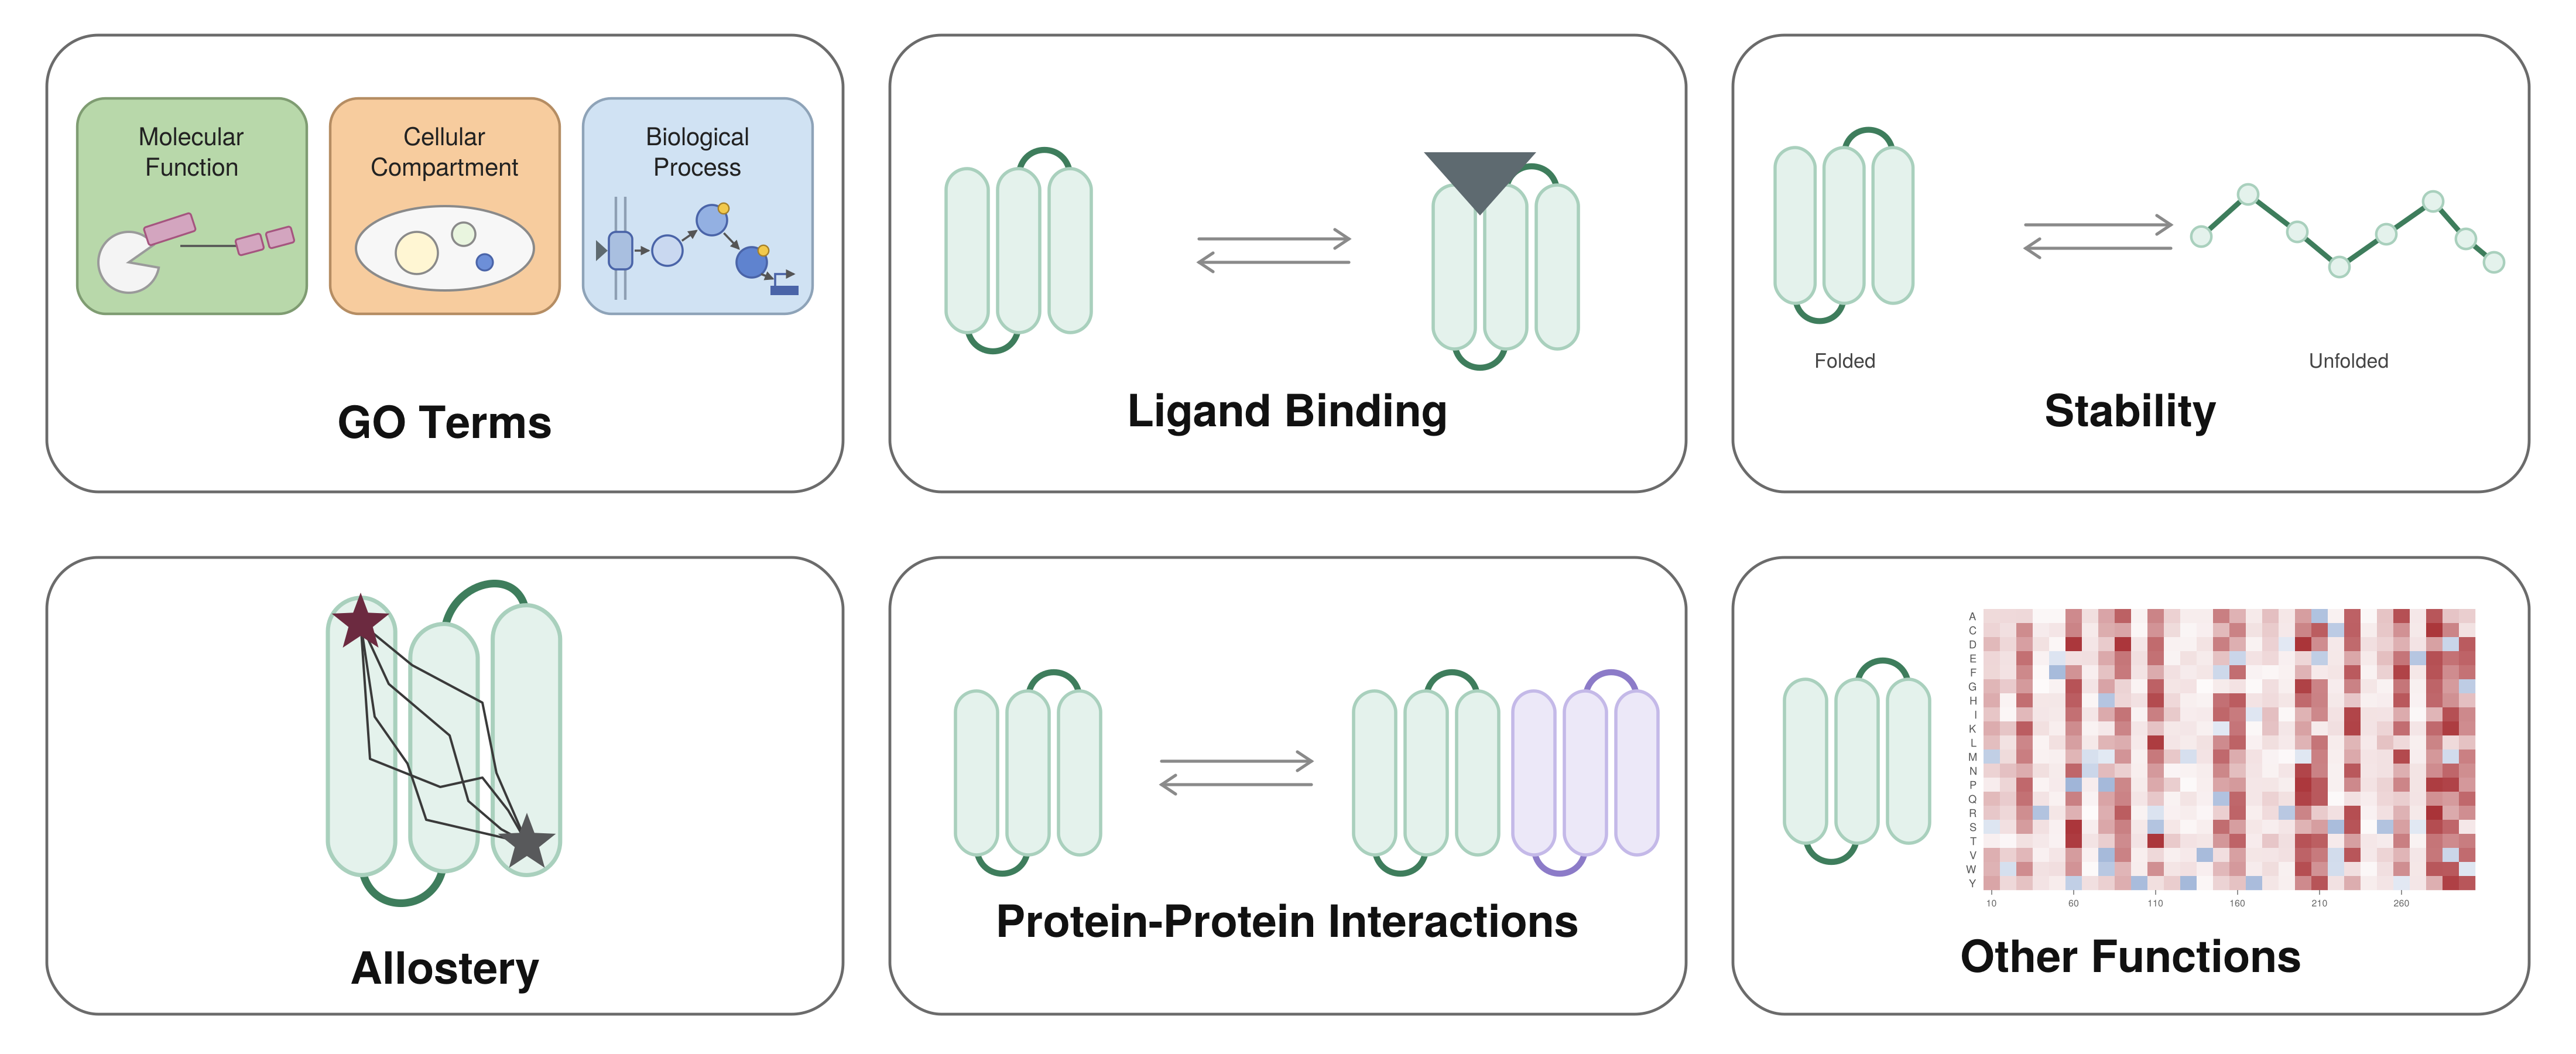
Figure 1. Protein function spans many distinct properties, and single-task evaluations capture only part of this space. Schematic of functional properties relevant to sequence-to-function prediction with benchmarks. Properties include Gene Ontology (GO) term annotations, ligand binding, thermodynamic stability, allostery, and protein-protein interactions.
High-throughput experimental methods now enable the collection of data on biophysical or function data at scale. Deep mutational scanning (DMS), binding assays, HT-MEK, and limited proteolysis assays, among others, report quantitative properties across thousands of variants. 20–23 However, each assay often measures a different molecular phenotype under a single engineered selection, such as fitness or survivability, stability, binding, or enzymatic turnover. A variant can be neutral in one assay's readout yet functionally disruptive through a different, unprobed mechanism. These assays are beginning to produce the scale of data machine learning needs; however, each captures only a subset of information needed to predict protein function. Other metrics of ‘function’, such as clinical pathogenicity, report on disease association rather than protein function. 24–25
Machine learning has become the dominant tool for learning sequence-to-function mappings. Its capacity to learn complex, non-linear patterns across vast sequence spaces offers a path toward capturing this complex mapping. 26–28 However, determining how well these algorithms predict function, and at what granularity, remains essential to building more powerful machine learning predictors and uncovering new biology. Existing benchmarks use varying functional datasets, reading out different types of functions. They also vary in size, sequence diversity, organization, and splitting strategy. 2, 29–30 As a result, performances across benchmarks are difficult to compare.
Rigorous evaluation of sequence-to-function models should contain three requirements: a clearly specified functional target, control of data leakage, and protection against contamination over time. A clearly specified target is a concrete task: “catalytic activity of a given enzyme” qualifies, while “protein function” does not. 31–32 Second, the benchmark must control data leakage. Leakage occurs when test information reaches training, inflating apparent generalization. 33 Leakage can arise from poor splits, from features that encode the target, and from group leakage, where related measurements land on both sides of a split. 33–35 Random splits assume independent observations, but proteins are related by evolution. When relatives fall on both sides, a model can recover the label from similarity alone. Shared ligands, assay formats, conditions, and mutation classes create the same shortcut. 36 Avoiding leakage and covering enough of protein space to train on are competing goals, and this tension is the central obstacle to generalizable benchmarks. 34 Individual datasets have addressed leakage, 23, 37–39 but no consistent definition has been applied across datasets. Finally, static benchmarks become contaminated as sequences and their homologs enter training corpora, so benchmarks must be updated and resplit continually.
Existing benchmarks meet these requirements only in part. Early functional benchmarks relied on small, idiosyncratic assay collections, 40 which made head-to-head comparison unreliable. The Critical Assessment of Functional Annotation (CAFA) crowdsources predictions of ontology terms such as GO annotations, but its temporal holdout does not explicitly exclude homology leakage. 2 The two main variant-effect benchmarks each cover one of the two axes a multi-property model needs, breadth across proteins and resolution across properties, but not both. ProteinGym is broad, assembling roughly 2.5 million missense variants across 187 wild-type proteins, but most measurements fall into general “fitness” or “activity” buckets. 29 These composite readouts entangle orthogonal effects, since a loss-of-function variant may reflect a defect in expression, stability, or activity, and a mutation that improves one property can impair another, obscuring how variants actually map to function. FLIP2 resolves specific properties, with separate benchmarks for enzymatic activity, folding stability, and binding affinity, but only goes deep on a few proteins rather than broad across many. 30 While both ProteinGym and FLIP2 split their data to reduce data leakage, neither dataset is broad in protein sequence while also reporting specific functional or biophysical properties. No existing benchmark fixes the test corpus across functional axes while controlling leakage against all of them simultaneously.
To characterize how well models can predict multimodal protein function, we introduce Protein Leakage-free evaluation for Unbiased Generators of function (PLUG). PLUG is a modular and extensible framework for leakage-free evaluation of prediction models across multiple functional measurements. It combines several diverse functional datasets and applies consistent splitting strategies so that performance is comparable across benchmarks. It generates homology-aware training reservoirs for foundation models, and homology-aware splits for supervised fine tuning (SFT) and transfer learning. The splitting strategy and similarity thresholds are tunable to enable future studies characterizing performance as a function of training similarity. Importantly, PLUG can accept new functional datasets and rebuild the corresponding training reservoirs as further experimental data are published, so evaluation adapts as models and datasets change. This modularity also allows users to incorporate in-house datasets, so that proprietary data can be evaluated alongside existing benchmarks with consistent homology control. We demonstrate PLUG's utility by analyzing the impacts of data leakage and characterizing orthogonal functional predictions from ESM3, showing that probe performance decreases by an average of 26% across eleven functional datasets. We propose adopting PLUG as a framework for continual evaluation of protein function predictors, with careful homology detection to assess generalization and performance as a function of training similarity.
Results
PLUG integrates diverse functional datasets
We developed PLUG to evaluate machine learning models across functional axes while consistently controlling for data leakage. This allows prediction algorithms to be assessed across distinct functional properties, establishing which functional axes an algorithm excels or fails on. It also enables transfer learning, where a model trained on one function (e.g., stability) can be evaluated on another (e.g., allostery) under the same split criteria. Together, these comparisons allow protein function prediction to progress. Code for PLUG is open source and can be found at https://github.com/prism-science/plug.
To develop the first version of PLUG, referred to as the PLUG benchmark in this manuscript, we took eleven datasets representing seven unique functional axes: GO annotations (from CAFA5 via BioReason-Pro), 2, 41–42 fitness labels (based on DMS; from ProteinGym), 29 small molecule binding affinity (from BindingDB and LP-PDBBind), 39, 43 allostery (from AlloBench and PASSerRank), 44–46 thermostability (from Megascale and FireProt via ThermoMPNN), 22, 47–48 protein–protein interactions (PPIs; from the gold-standard PPI dataset and STRING’s SHS27K), 23 and molecular dynamics (MD) root mean squared fluctuations (RMSF) (from ATLAS). 49–54 Table 1 provides details on the initial set of included datasets. In total, the PLUG benchmark covers 36,816 unique wild-type proteins and contains over 3.1 million unique measurements. Further details on the datasets can be found in the Supplementary Information.
| Dataset | Function/Property | Number of Unique Wild Type Sequences | Number of Measurements |
|---|---|---|---|
| ATLAS 55 | MD RMSF | 1,693 | 1,938 |
| AlloBench 44, 46 | Allostery | 425 | 2,257 |
| PASSerRank 45–46 | Allostery | 331 | 1,885 |
| STRING SHS27K 56–57 | Protein–Protein Interaction | 1,690 | 7,624 |
| Gold Standard PPI 23 | Protein–Protein Interaction | 11,019 | 274,500 |
| ProteinGym 29 | Binding | 12 | 751,063 |
| ProteinGym 29 | Expression | 18 | 97,869 |
| ProteinGym 29 | Organismal Fitness | 65 | 1,034,722 |
| ProteinGym 29 | Activity | 40 | 447,319 |
| ProteinGym 29 | Stability | 66 | 134,794 |
| Megascale 22, 48 | Stability | 298 | 271,231 |
| FireProt 47–48 | Stability | 100 | 3,404 |
| CAFA5 2, 41–42 | Gene Ontology | 8,528 | 8,630 |
| BindingDB 43 | Small Molecule Binding | 2,156 | 76,866 |
| LP-PDBBind 39 | Small Molecule Binding | 12,718 | 19,443 |
Table 1. Included Functional Datasets. The dataset is listed along with the function it covers, the number of unique wild-type protein sequences it contains, and the total number of measurements it contains.
Controlling for Leakage Among PLUG Datasets
Entries in biological function datasets often share sequence, structure, ligand composition, and binding partners. These similarities can result in data leakage, inflating confidence in a model’s generalization. As each dataset typically defines their own train/validation/test splits, it is difficult to evaluate SFT or transfer learning across these datasets. PLUG applies the same splitting scheme across all functional datasets. The PLUG framework is amenable to any definition of leakage that can be quantified with a similarity measure. Further, most leakage parameters are user-tunable, which allows construction of a dataset suited to a given application.
The default values in the PLUG benchmark consider proteins to be similar if they have a sequence ID greater than 30%, a TM-score greater than 0.7, and Tanimoto score greater than 0.5 using the Morgan Fingerprint with radius of two (Figure 2A). 58–62 For sequence similarities, we consider three types of coverage (Figure 2B). Mode 0 requires the alignment to cover 80% of both the target and query sequences, so it flags only pairs of similar length. Mode 1 requires 80% coverage of the target sequence. This identifies matches where most of the target sequence is similar to a region in the query sequence, capturing the case where a shorter target sequence fits within a longer query sequence. Mode 2 requires 80% coverage of the query sequence. It catches the reverse case: a short query protein that is a subset of a longer target protein. For example, consider a 600-residue query protein that contains a domain identical to a 200-residue target protein. The alignment covers 100% of the target sequence but only 33% of the query sequence. Mode 1 measures coverage of the target sequence, sees 100%, and labels it a match. Mode 2 catches the same pair when the roles are reversed, with the 600-residue protein in the target set.
PLUG combines modes 1 and 2. Two sequences are considered similar if they share more than 30% identity with more than 80% coverage in either direction (COV_MODE = 1 ∪ 2). We implement this bidirectional union protocol, which searches for homologous sequences first from query (e.g., UniRef90 sequences) to target (e.g., PLUG benchmark) and then from target to query using the multiple coverage modes of MMseqs2 and the target and query TM-scores from Foldseek. 58, 63
Use cases for PLUG
PLUG supports three main use cases; foundation model pretraining, SFT, and representation and transfer learning. For foundation models, it generates homology-aware training reservoirs. For SFT and transfer settings, it generates homology-aware splits with tunable similarity thresholds.
Pretraining. PLUG filters unlabeled pretraining data to prevent leakage into downstream functional evaluations. The user supplies a reservoir of protein sequences or structures and a target pretraining dataset size. PLUG scans each pretraining candidate against all proteins in the 11 benchmark datasets and rejects candidates with homology above the leakage thresholds. Sampling continues until the pretraining target size is reached. The resulting dataset contains no homologs of any evaluation protein, so a foundation model trained on it can be evaluated on every functional axis without leakage. Comparing models trained with and without this filtering measures how much pretraining overlap inflates downstream performance.
Supervised fine-tuning. For SFT on a single functional dataset, PLUG splits that dataset into train, validation, and test sets using default or user-defined thresholds. Splitting biological data into maximally dissimilar groups is NP-hard, and many heuristics exist. 23, 37–39 For single-dataset splits, PLUG uses DataSAIL, which minimizes the total sequence similarity between proteins assigned to different partitions. 37 DataSAIL defines leakage as an objective in an integer linear program, penalizing homologous pairs occurring in different splits. 33, 37, 64 However, homologs can still land in different splits if the penalty is too weak. Each entity can be compared under only one similarity definition, unless the user builds a custom score that combines several. And pooling all datasets produces one large connected component that cannot be broken into smaller stratified splits. DataSAIL splits therefore control for leakage only within a single dataset.
Transfer learning. PLUG also supports transfer learning. Transfer learning evaluates how well a model trained to predict one function/property can predict a different function/property. Here, homology must be controlled across datasets at once. For example, a model can be fine-tuned to predict residue root mean square fluctuation (RMSF) on ATLAS and then used to predict allosteric effects in AlloBench. 44, 55 If homologous proteins appear in both datasets, the model can succeed by recognizing proteins it has already seen, deflating its performance. To solve the issue of transfer between datasets and to generate a stricter leakage guarantee, we use the method described in the Lo-Hi benchmark, constraining leakage while maximizing the retention of usable, leakage-free data in the splits. 65–66 By solving the balanced vertex minimum k-cut problem, we provide a strict homology guarantee across splits, but at the cost of removing datapoints. 67
To formulate this optimization problem, PLUG builds a graph in which each node is a unique protein or ligand. An edge connects two nodes if they exceed any similarity threshold (sequence, structure, or ligand) as described above (Figure 2A/B). Connected components are assigned to train, validation, and test splits, with measurements from each dataset stratified across the splits (Figure 2C). Transitive connections can link many nodes into one component that would be too large to fit any split. In this case, we remove central nodes, thereby cutting the graph into smaller components that satisfy the constraints. Under these assumptions, the split assignment (train, validation, test, or cut) then becomes a decision variable resulting in multiple valid assignments with varying numbers of nodes dropped from occupying multiple splits. The optimizer chooses the distinct set of cuts that retain the most data, subject to three constraints: partition sizes, one assignment per node, and pair relationships. Ligands are split by a second k-cut on the ligand graph, weighted by the number of data points whose protein was assigned to each split. Finally, any protein–protein or protein–ligand pair whose members fall in different splits is dropped. This formulation guarantees that no two homologs nor binding partners can appear in different splits.
We used this algorithm to generate 80/10/10 train, validation, and test splits across all datasets, with a 5% tolerance on partition size. Split fractions apply to proteins in single-protein datasets and to rows in paired datasets. A pair is kept only if both partners fall in the same split, so strict leakage control discards some data. Across all datasets, the k-cut solution retains 78.4% of data points and 65.4% of unique proteins. The dropped proteins are highly connected members of overrepresented families (Fig S4). The number of proteins dropped varied by dataset. For example, the final splits retain 184 of 298 Megascale wild-type proteins, with 153 (83.2%) in train, 16 (8.7%) in validation, and 15 (8.2%) in test. BindingDB retains 34,375 of 76,866 protein–ligand interactions, split into 28,703 train, 2,912 validation, and 2,760 test.
To incorporate a new dataset, a user can add a simple adapter to the benchmarks directory that parses the raw data and returns a list of datapoints. The user then specifies the similarity measures that should be taken into consideration as well as any classes to stratify on. Rerunning the scripts then rebuilds the similarity graph under the configured thresholds and writes a new set of split labels. Similarly, once the adapter is registered in the codebase, rerunning the unlabeled dataset sampling extends the screen to exclude homologs to the new data.
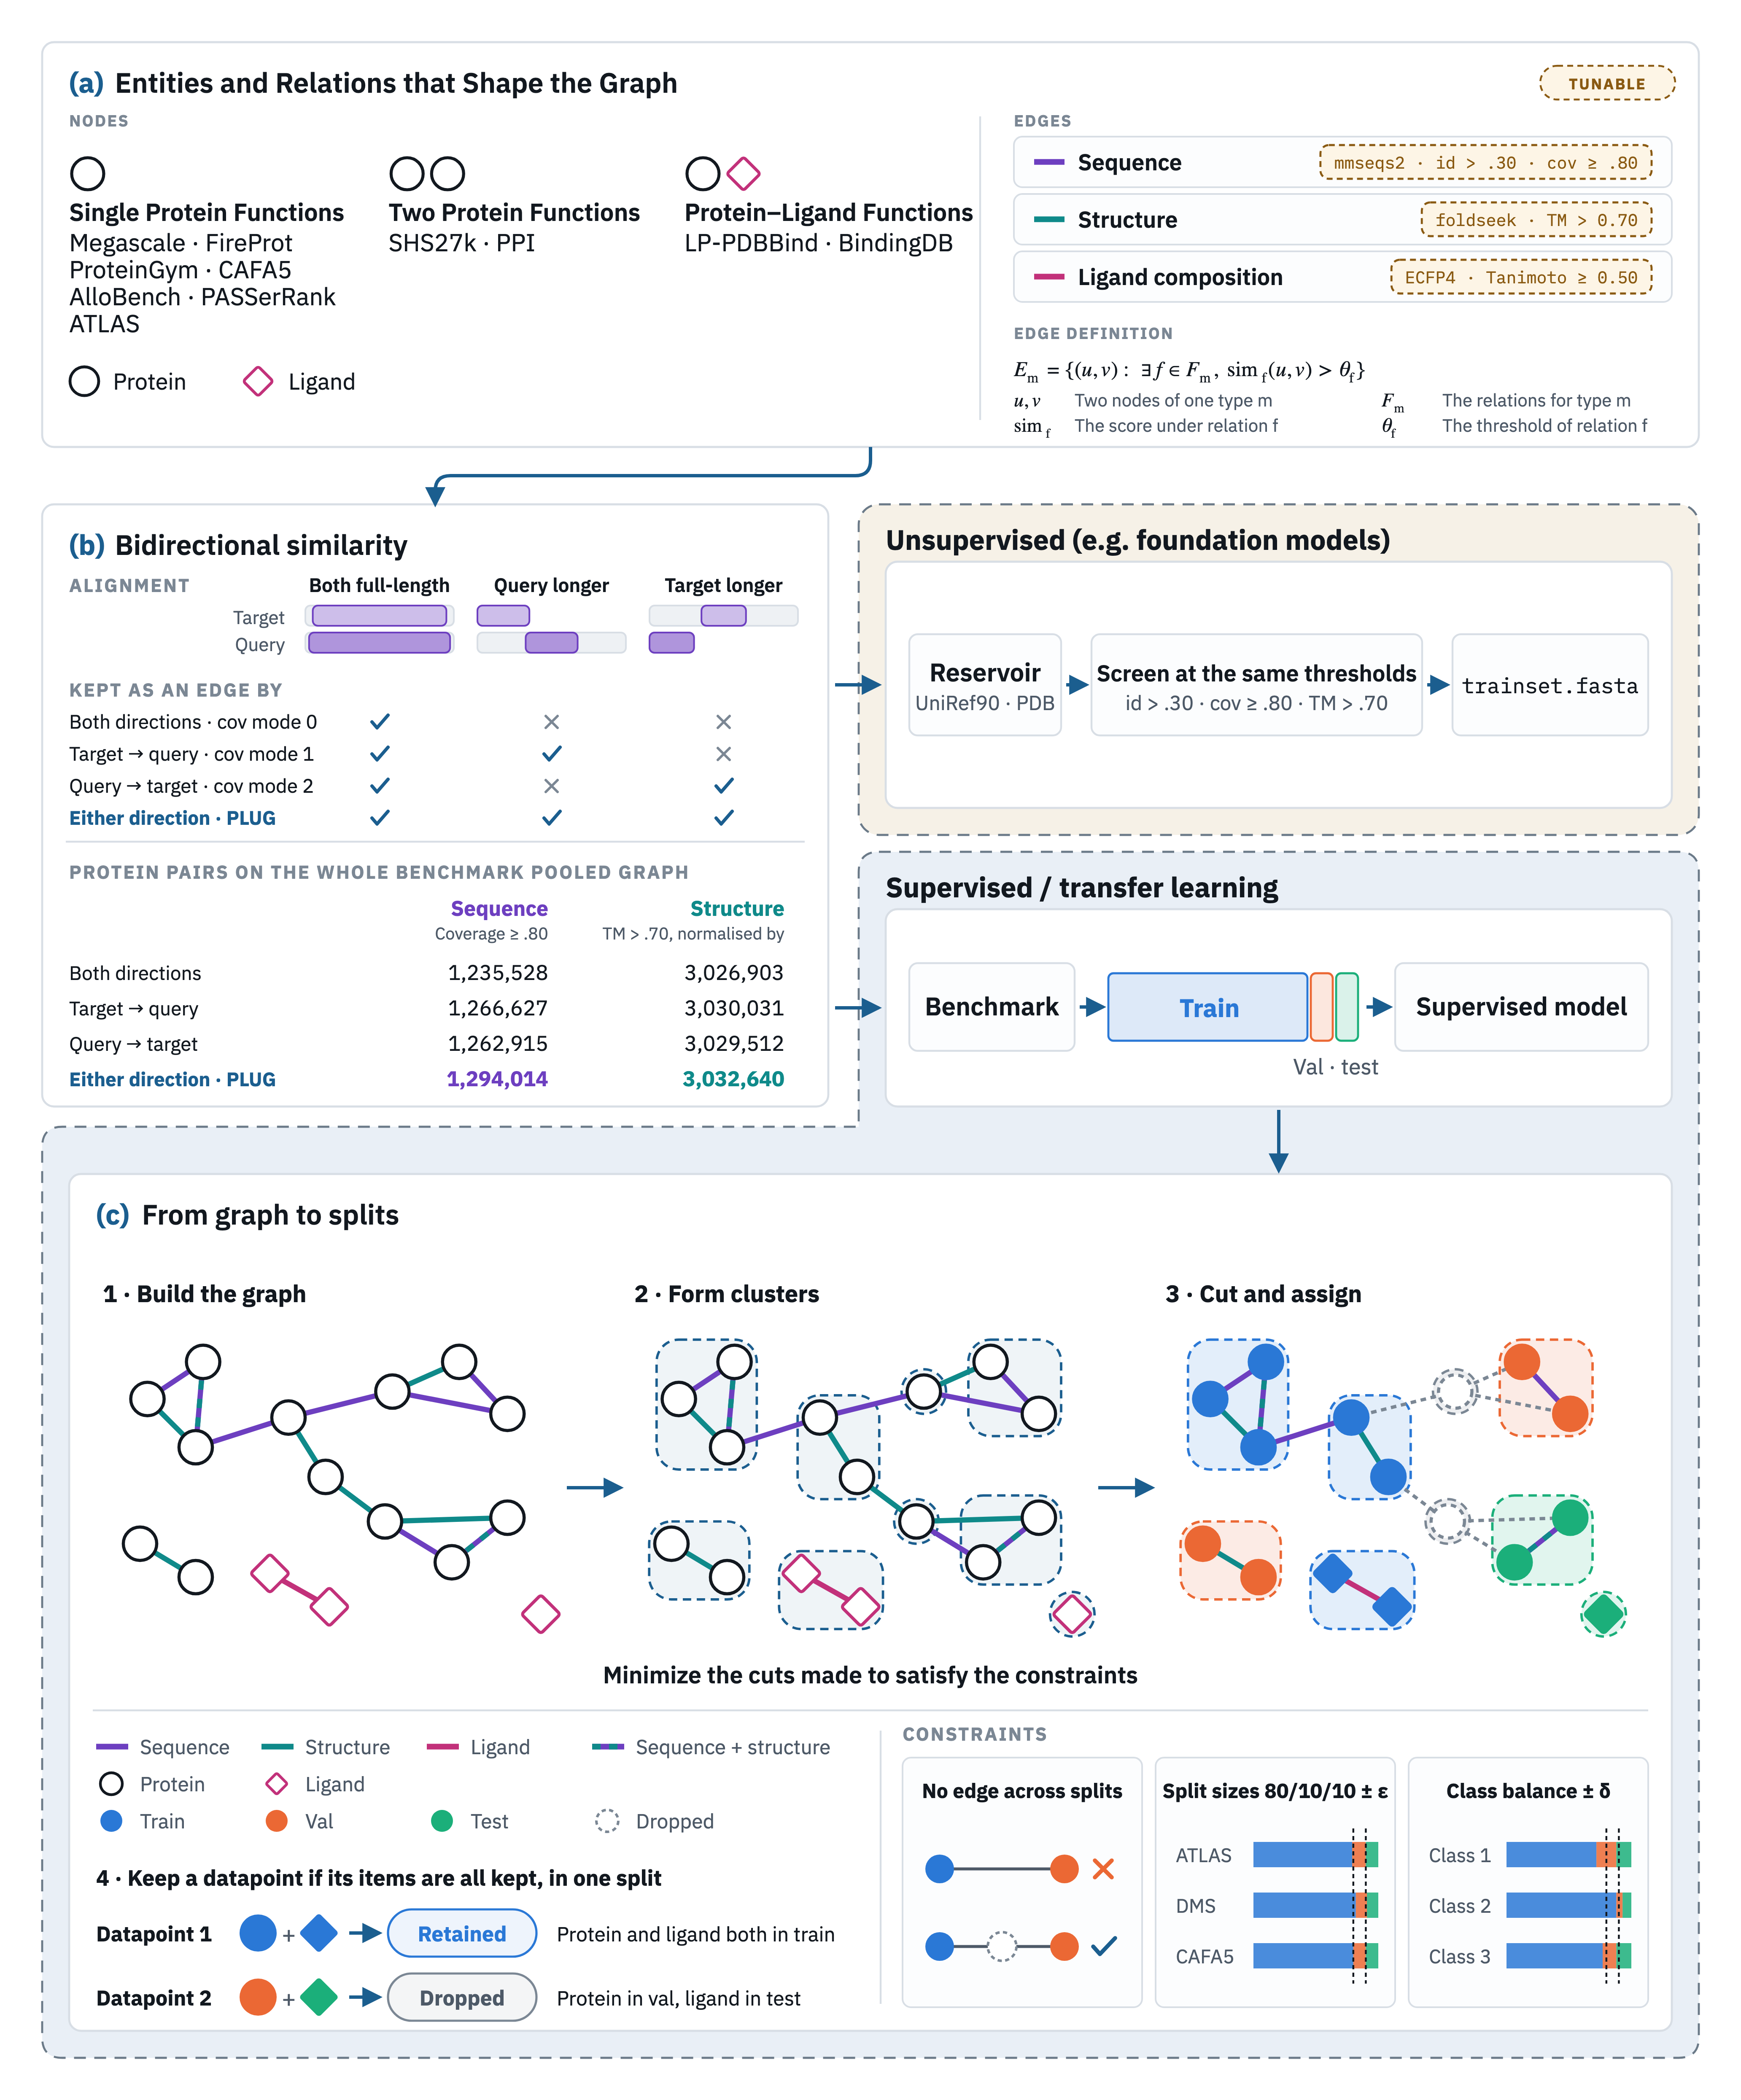
Figure 2. Overview of the PLUG method.
(A) Datapoints can exist as single entities (i.e., just a protein) or pairs (i.e., protein–protein or protein–ligand) and homology between entities can be based on sequence, structure, or composition (ligands). Default parameters are 30% sequence identity with 80% bidirectional coverage, 0.7 TM-score, and 0.5 Tanimoto, but are tunable by the user.
(B) PLUG checks for similarity in three modes. Coverage mode 0 considers the full length of both the target and query sequence, coverage model 1 considers the full length of the target sequence, and coverage mode 2 considers the full length of the query sequence. PLUG checks sequences from both query to target and then target to query and a hit is reported in either direction with sufficient coverage. The same principle is applied to the TM-score, which has separate alignments on query and target. Tanimoto similarity is a symmetric measure so does not require this method. Using this scoring, proteins can be screened out of pretraining corpora for unsupervised learning or datasets can be split into homology-aware train, validation, and test sets for fine tuning and transfer learning.
(C) To split existing datasets, a similarity graph constructed using all proteins in the benchmark. Sequence, structure, and ligand similarity measures are built into the edges of the graph rather than optimized. Following the Lo-Hi method, connected components are assigned to data splits greedily for small components and by cutting large components that do not fit in a split. The solver finds the minimum number of graph cuts to maximize the retained data (the number of row weighted proteins) subject to one-assignment-per-datapoint, no edge joining two splits, partition size, row floor, and class stratification constraints
PLUG Challenge on Hugging Face
To facilitate community engagement we developed a website to track evaluations of nascent models on Hugging Face (https://huggingface.co/spaces/PrismScienceOrg/PLUG-challenge). 68 Predictions can be submitted to a leaderboard and model performance is evaluated on each dataset separately as well as the benchmark as a whole. Users submit a link to the code or literature describing the method used for predicting functions. Because the benchmark spans both regression and classification tasks, each metric (Spearman correlation, AUROC, and ) is normalized so that 0 corresponds to random chance (Spearman = 0, AUROC = 0.5, = 0) and 1 to a perfect prediction. Methods are ranked by an overall PLUG score reflecting their improvement over random chance and the leaderboard can be sorted by performance on individual datasets. If a single or subset of functions are submitted, the left out datasets are scored as chance in the overall PLUG score. There are separate leaderboards for unsupervised and supervised models. Unsupervised models are evaluated on all data from each benchmark dataset, whereas supervised models are evaluated on only the held out homology test sets for each benchmark dataset. Version controlled updates of PLUG will include additional functional datasets as they continue to grow in size and scope allowing researchers to track the progress and adaptability of models.
Substantial Overlap Among Functional Datasets and Pretraining Corpora Creates Data Leakage Risk
To demonstrate the impact of PLUG’s splitting, we first measured overlap between functional datasets, and between those datasets and pretraining corpora. For each dataset, we calculated the percentage of proteins with a homolog within datasets as well as all other datasets and all other datasets of a different function (>30% sequence identity and 80% bidirectional coverage; Figure 3A). For example, 138/298 (46%) Megascale sequences have a homolog in ProteinGym. In the other direction, 73/187 (39%) ProteinGym sequences have a homolog in Megascale. Of these, 64 sequences are exact matches because some assays appear in both datasets. Among datasets measuring different functions, CAFA5 and PPI overlap the most (80%), while both show the least overlap with FireProt (~1%). Most proteins in several datasets have a homolog in a dataset measuring a different function (88% of ProteinGym, 88% of AlloBench, and 89% of BindingDB). This overlap creates a substantial risk of data leakage (Figure 3B).
Because a fixed identity threshold captures only whether a homolog exists, not how similar it is, we also measured overlap as the mean best-hit sequence identity between datasets (Figure 3B). For each query sequence, we took its highest MMseqs2 identity to any sequence in the target dataset and averaged these values across the query dataset. 58 Diagonal values exclude self-matches and therefore reflect each dataset’s internal sequence redundancy. The largest overlaps are between datasets from common sources including AlloBench and PASSerRank and between PPI and SHS27K. Megascale is the most dissimilar to other datasets (mean best-hit identity ranging from 0.06–0.38), consistent with its high proportion of engineered proteins. LP-PDBBind 39 has the highest internal identity (0.87), reflecting its makeup of well-studied proteins screened against many ligands. For the five datasets with RCSB PDB identifiers (ATLAS, AlloBench, PASSerRank, FireProt, and LP-PDBBind), we also assessed structural overlap using a TM-score threshold of 0.7. 39, 44–45, 47, 55 Structural comparisons detail a similar pattern of overlap between the datasets with deposited structures (Supp. Figure 1). AlloBench, PASSerRank, FireProt, and LP-PDBBind each have structural homologs in another dataset for >83% of their proteins, while ATLAS, which is curated to be structurally diverse, only shows 43% structural overlap. The sequence, structure, and ligand overlap across benchmark datasets makes multifunctional evaluation difficult without jointly considering splitting.
We then ran an experiment mimicking an unlabeled training set used by modern protein language models (PLMs). We uniformly sampled one million candidate sequences from UniRef90, restricting the lengths to between 20 and 1000 residues to evaluate the overlap with the PLUG datasets (Figure 3C). At ≥ 20% sequence identity, 38.5% of the sampled sequences have a homolog in at least one PLUG dataset, falling to 21.5% at 30% identity and 8.0% at 50%. This highlights the leakage that can arise from pretraining models on datasets with homologs in downstream evaluation sets in as much as the pretraining and downstream objectives are aligned. 35, 69 Distinguishing this leakage from genuine functional performance, however, is difficult. In masked language modeling (MLM), PLMs learn to predict masked residues from their sequence context, so the patterns they learn reflect the statistics of the natural proteins in the pretraining corpus. 26, 70 A high likelihood could therefore indicate true evolutionary fitness or simply that a sequence, or its homologs, was in the pretraining set. If pretraining is broad enough, a PLM may learn a valid evolutionary prior that fine-tuning then transfers to more specific functions. 26, 70 If not, pretraining on test-set homologs creates a leakage risk, and filtering steps like those described here should be applied.
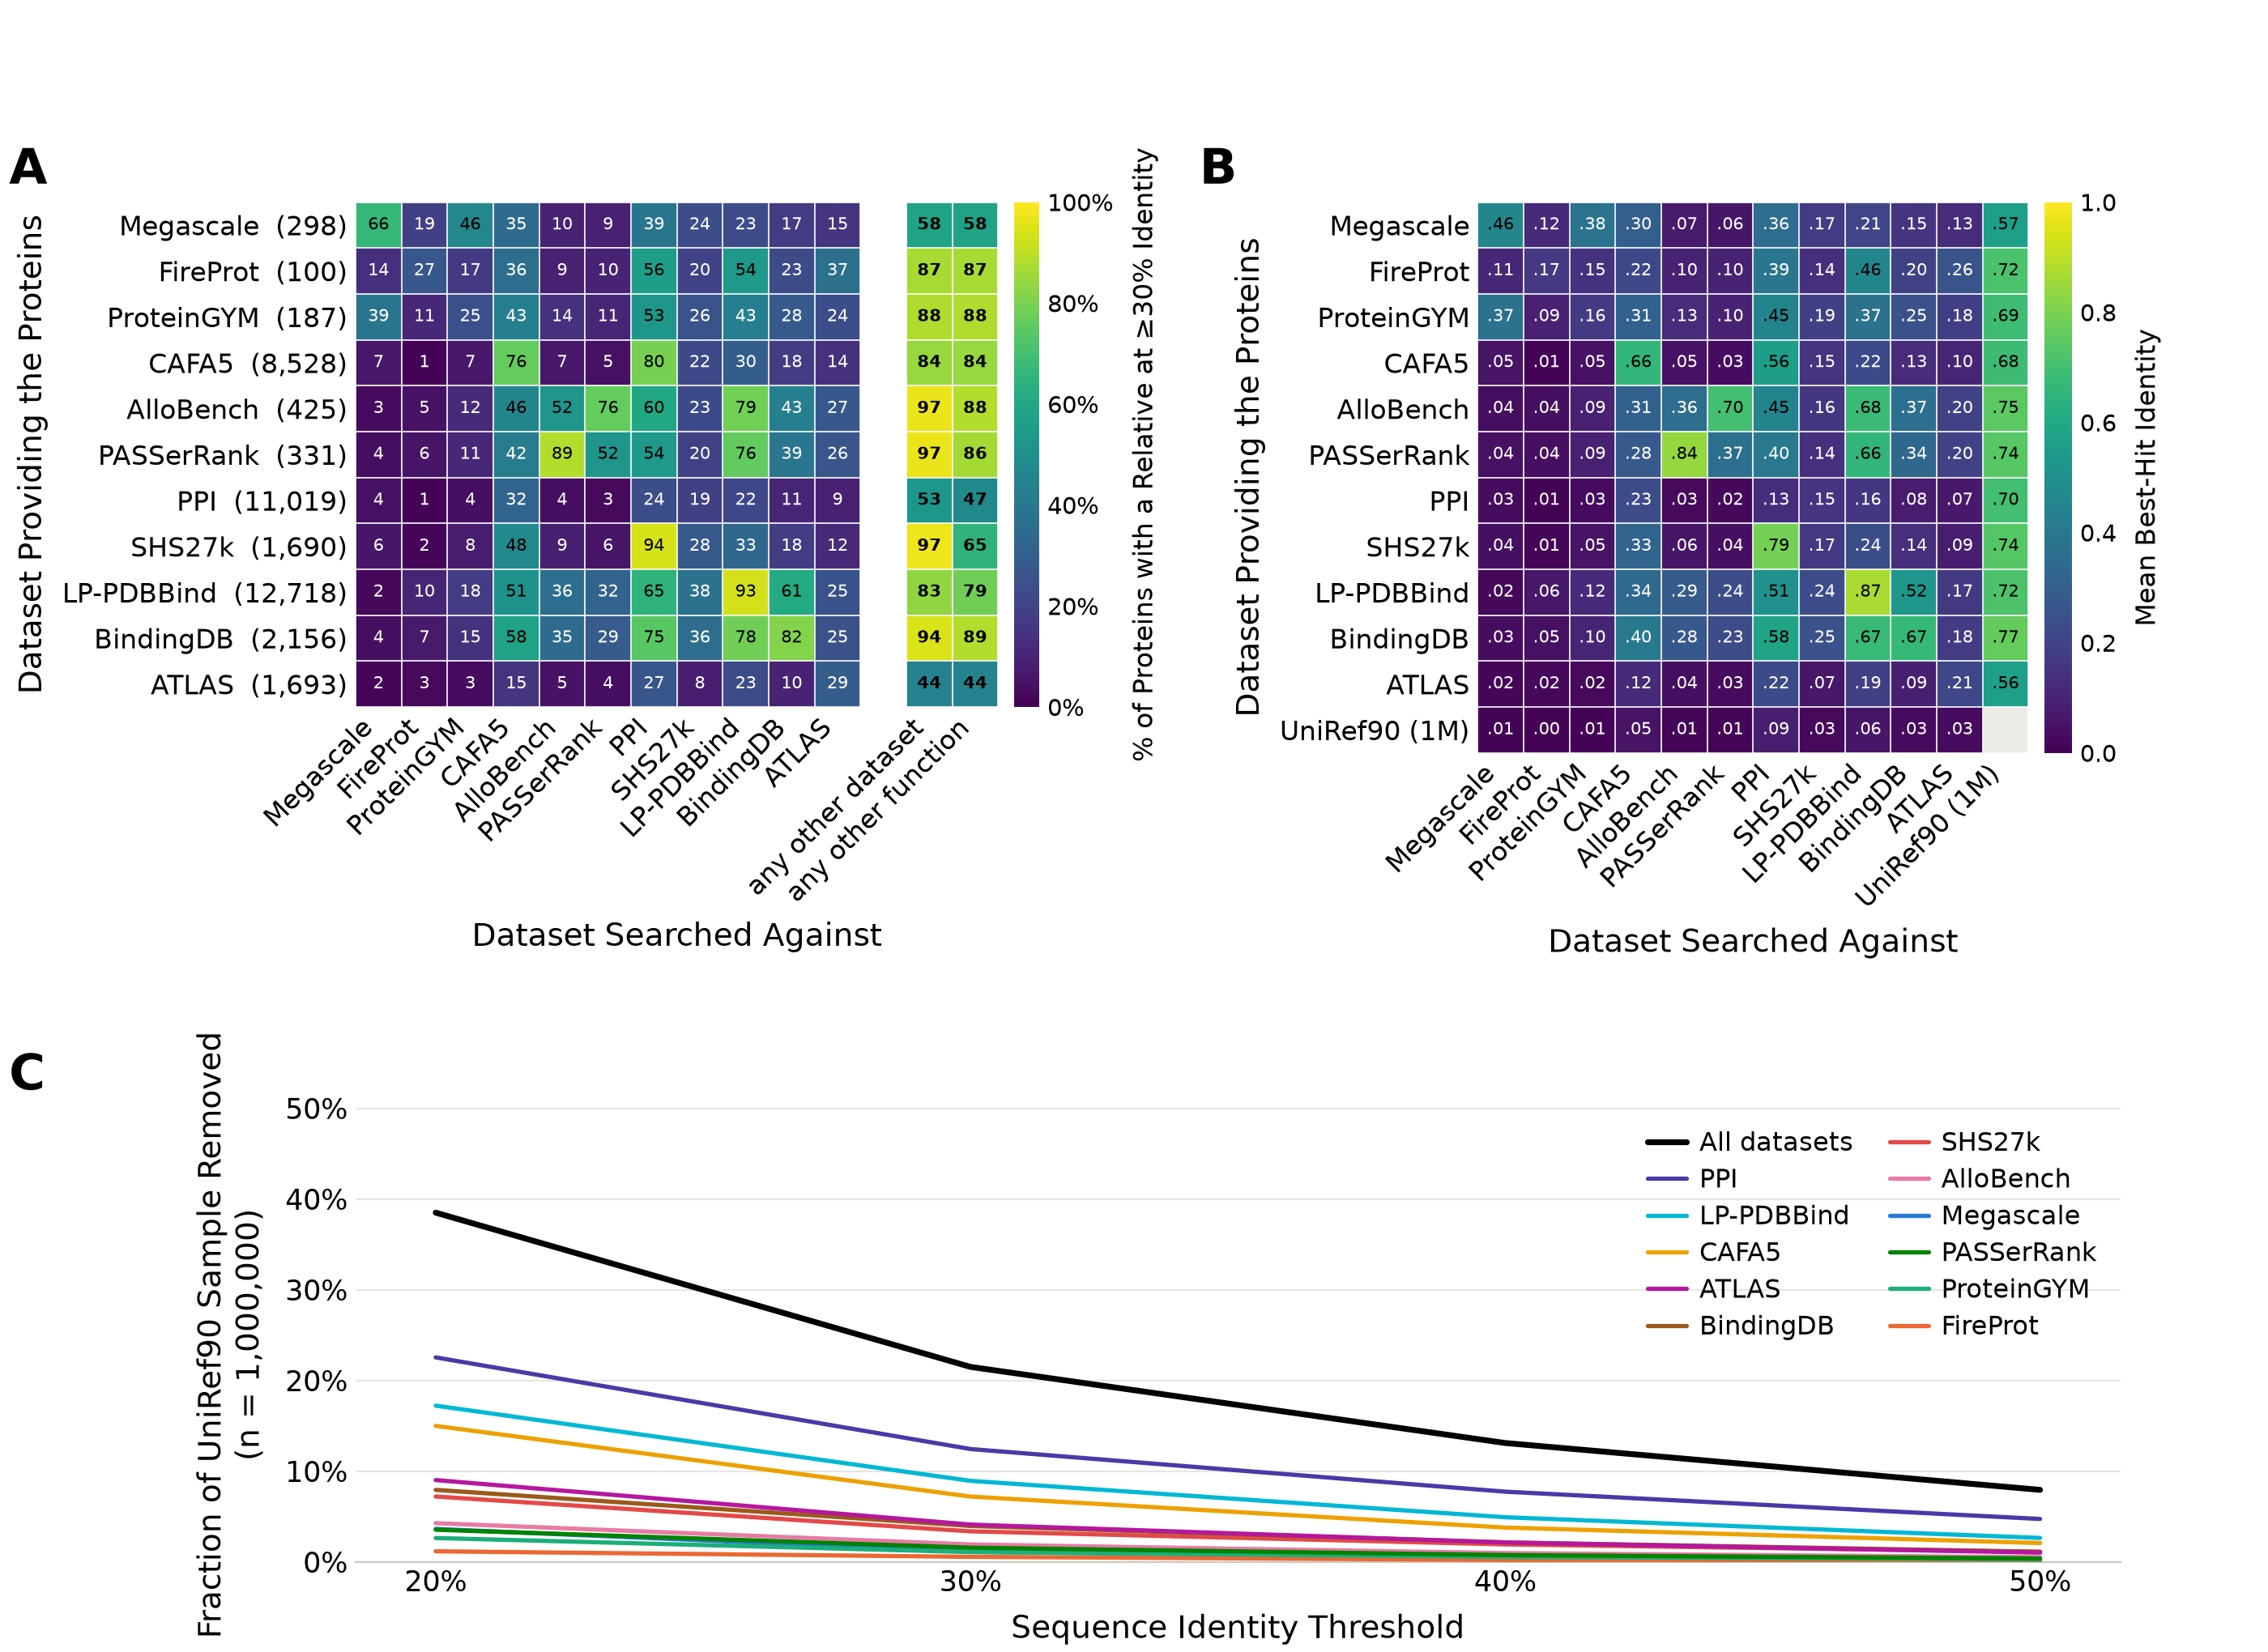
Figure 3. Sequence similarity between datasets and effects on a held out training set.
(A) The percent of sequence homologs (30% ID, coverage >80% bidirectional) in each pair of databases. The wild-type sequences in the row database are searched against those in the column database and the percent with a homolog is reported. The diagonal represents internal redundancy and is indicative of where a random split can cause leakage. The two columns on the right indicate the fractional overlap to all other datasets and all other datasets of a different functional axis, respectively.
(B) The mean best-hit ID of sequences compared across all datasets and the UniRef90 sample. The diagonal is the internal self similarity of the benchmark without same-sequence comparisons, which indicates the diversity of sequences in a given set.
(C) Screening a uniform sample of sequences from UniRef90 (n=1,000,000) against each dataset reveals sequences with a relative in the evaluation. Screening against all datasets at once finds 38.5%, 21.5%, 13.1%, and 8.0% homologs at 20% ID, 30% ID, 40% ID, and 50% ID, respectively.
Homology-aware splits reveal leakage that inflates protein language model performance
To demonstrate baseline evaluation with PLUG, we benchmarked ESM3 embeddings with linear and nonlinear probes on each functional dataset, comparing splits generated on single datasets with DataSAIL and across datasets with Lo-Hi. 26, 37, 65 We compared each splitting method to a size-matched random split that ignores homology. To ensure that the test sets were the same difficulty, we sampled the matched random splits until the zero shot performance was comparable. This helps distinguish whether any drop in probe performance reflects leakage removal rather than testing on a set of intrinsically harder proteins. Here, zero shot property prediction uses the log-likelihoods (single sequence), masked marginal ratios (mutation based properties), and log-likelihood difference (multisequence) values directly from the model to map to a function. For single property predictions this pretraining result, which measures sequence likelihood in the training set, can be correlated to the downstream objective, like thermostability. For multi-property predictions, like the hierarchically structured GO labels, a single value is not expected to be predictive of the multiple terms. Nevertheless, for consistency, we provide zero shot evaluations on all datasets in PLUG to demonstrate a baseline performance. This further provides a comparison of the alignment of the pretraining and downstream objectives and test set distributions as a result of the homology splitting procedures. 35, 69–70
We used ESM3 (esm3-sm-open-v1) to generate residue-level log-likelihoods and embeddings for each protein sequence in the PLUG benchmark. 26 For the small molecule binding datasets (BindingDB and LP-PDBBind), we used ChemBERTa (ChemBERTa-77M-MLM, ChemBERTa-77M-MTR) to encode SMILES strings. 71–72 We used masked marginals and log-likelihoods as zero-shot predictors, and used frozen embeddings as input to a linear probe (ridge regression for regression tasks, logistic regression for classification) and to an MLP with a single hidden layer. We did not fully fine-tune the models or extensively optimize probe hyperparameters; the only tuning was a sweep of the ridge regularization parameter on each validation set.
The size-matched random splits (Random @ Datasail and Random @ Lo-Hi) outperform the DataSAIL and Lo-Hi splits on most tasks, indicating data leakage (Figure 4). Both similarity-aware splitting strategies reduced performance relative to size-matched random, with Lo-Hi splitting having a larger drop in performance (Table S2). These averages are largely driven by the small molecule binding tasks. With an MLP probe, BindingDB has a 42% reduction in performance and LP-PDBBind has a 72% reduction in performance. On classification tasks and on CAFA5, which is the only dataset scored with Lo-Hi and DataSAIL produced similar drops in performance.
The size of the drop varied across functional axes, likely due to how we performed data splitting. We show that performance drop from homology aware split is highly correlated with inherent dataset diversity (Supp. Figure 5). The most significant drops in performance are concentrated in the tasks where the label is a property of the whole protein or protein complex that could be shared by a homolog. Tasks that describe mutational effects showed higher zero shot performance compared to allostery, RMSF, binding and GO labels, which consistently scored near random chance, consistent with prior benchmarking efforts. 70 The mutational and local function benchmarks (ATLAS, Allobench, PaSSerRank, Megascale) show smaller but still meaningful drops from homology splitting than the small molecule and binding type classifications (LP-PDBBind, BindingDB, and SHS27K).
Additionally the gold standard PPI benchmark shows a smaller effect from the leakage control compared to SHS27K, likely due to the nature of its construction. In the PPI benchmark, the set of proteins with positive interaction labels were scrambled and recombined into a roughly equal number of negative pairs without experimental evidence of interaction. 23 This method of protecting for data leakage differs from Lo-Hi and DataSAIL by acting on the labels rather than the homology of the inputs, but appears effective in reducing memorization from sequence features alone.
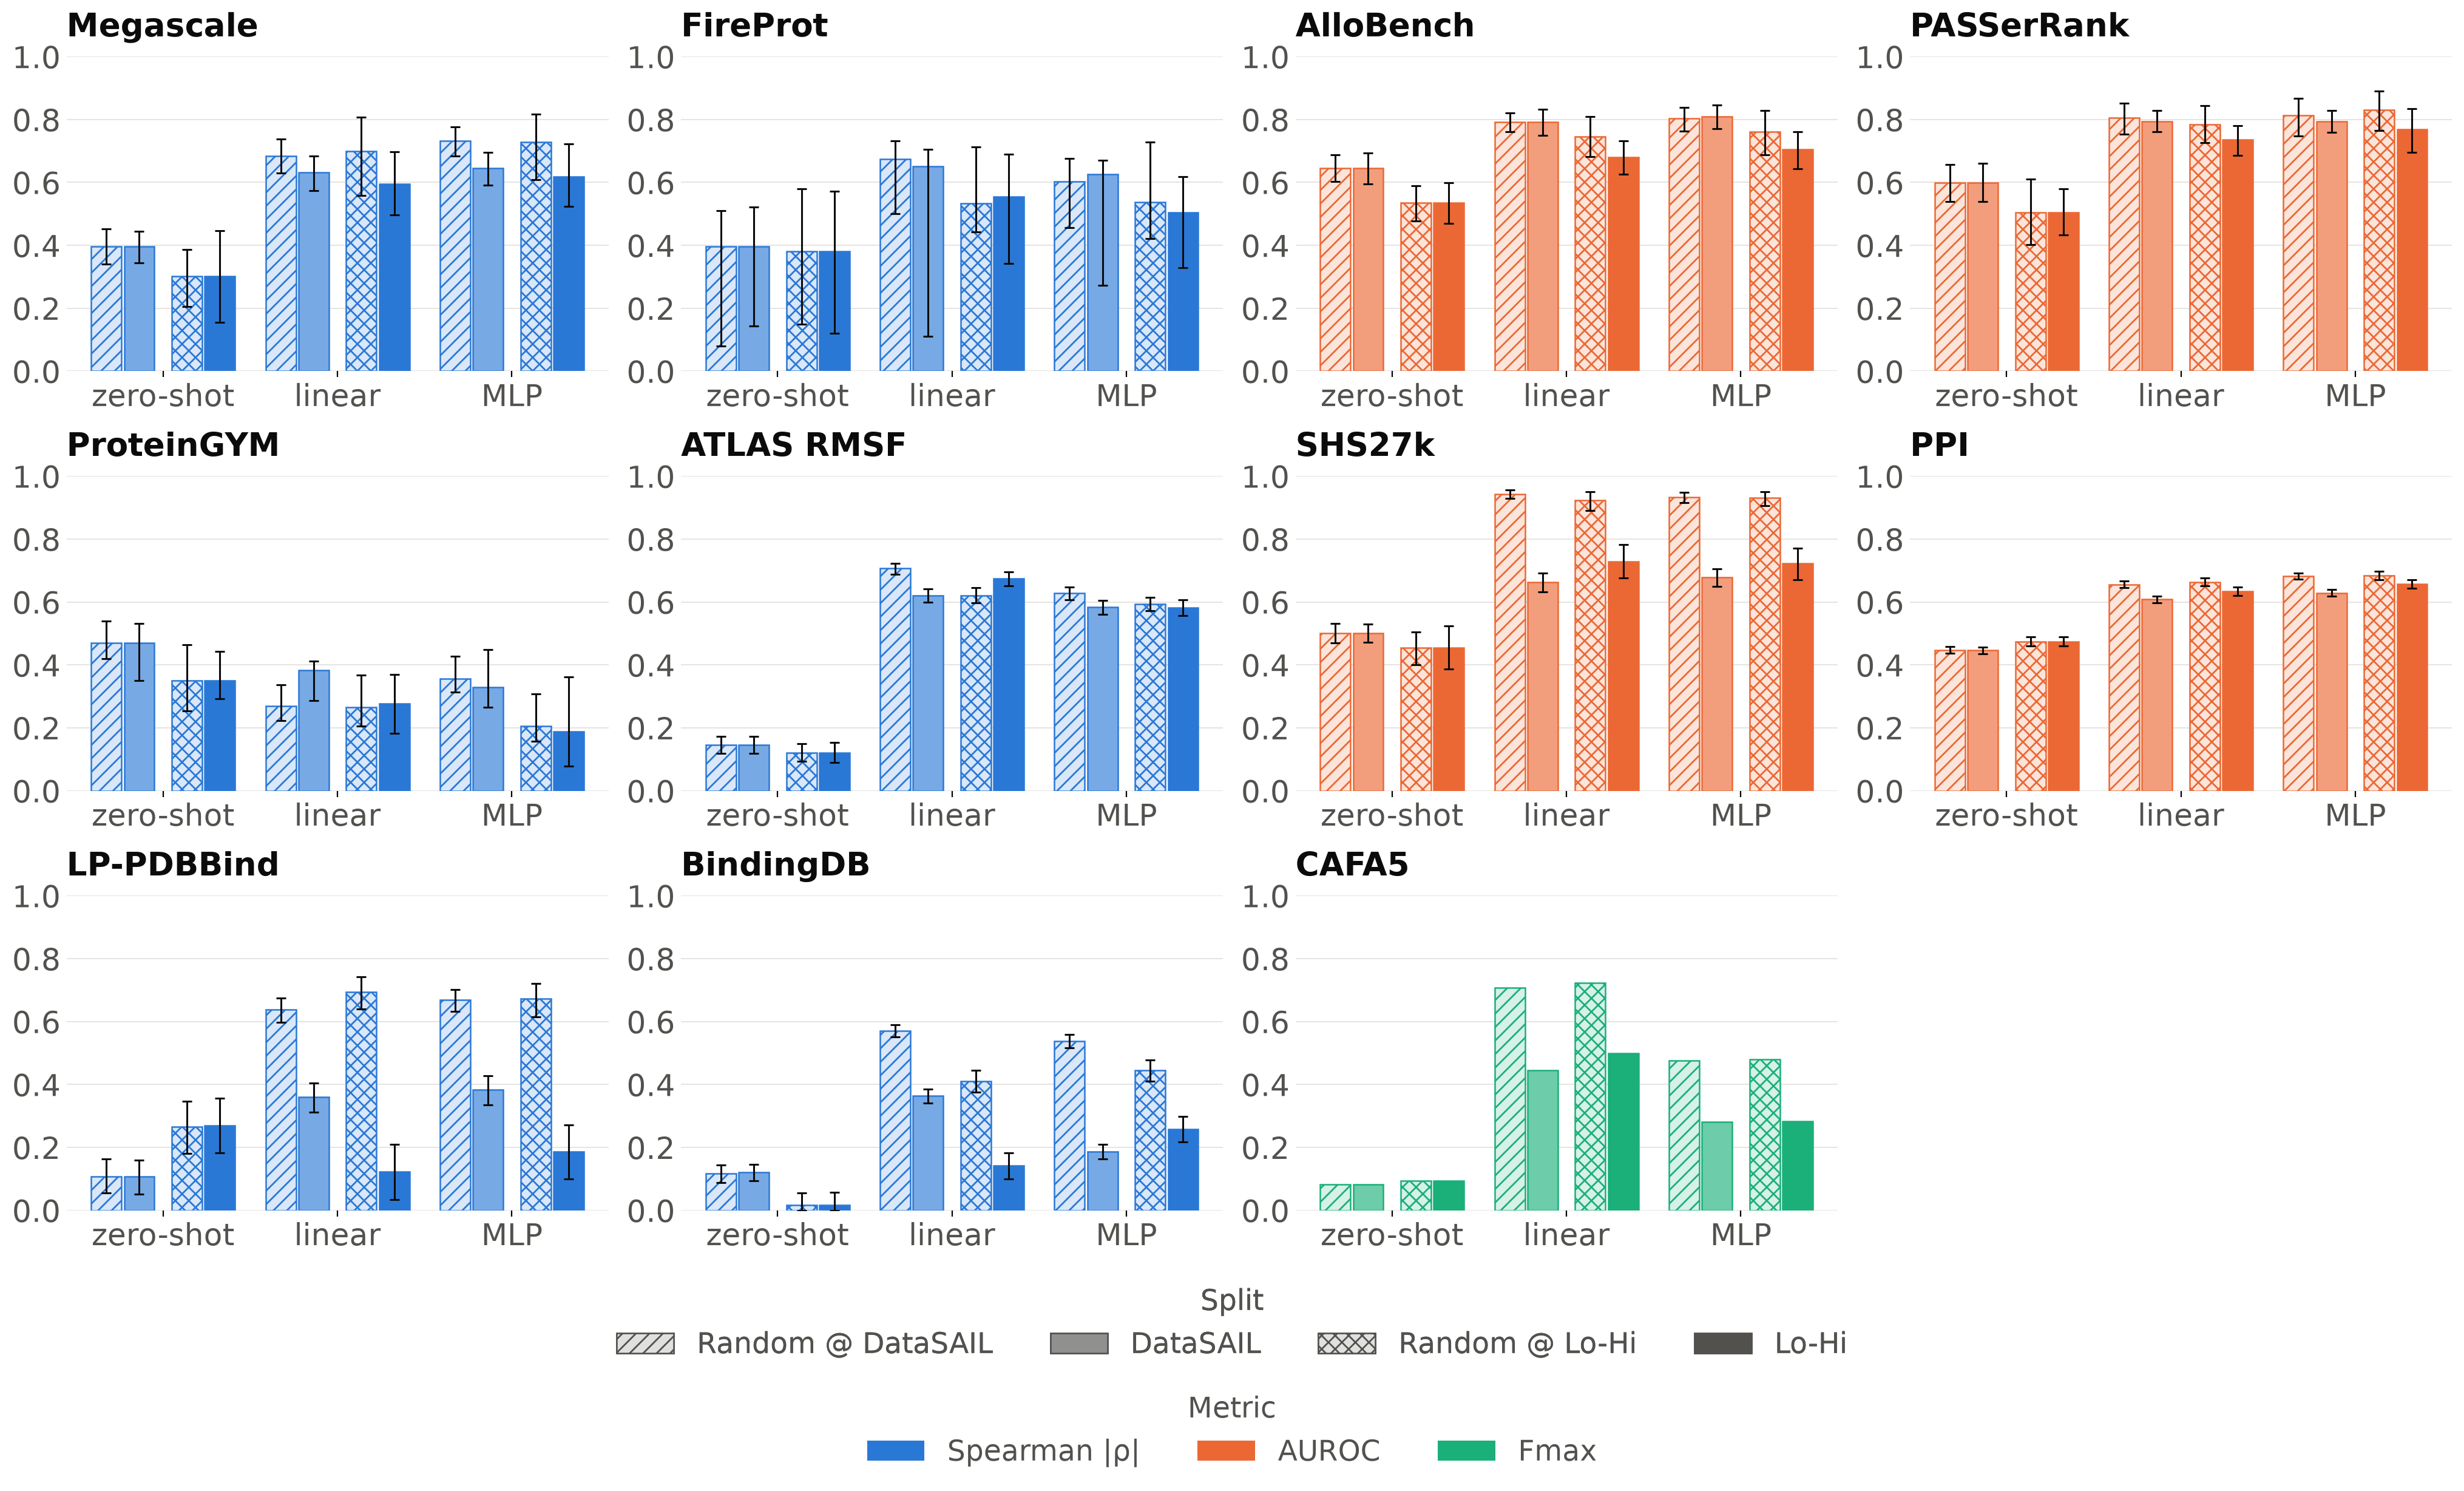
Figure 4. Baseline evaluation of frozen ESM3 embeddings on functional datasets highlights the need to control for data leakage. Each benchmark is scored zero-shot (using masked marginals from mutations or log likelihoods from sequences) and with linear and nonlinear probes trained on the two different splitting strategies and compared to size and difficulty matched random splits. Zero-shot performance is reported with . Random splitting inflates evaluations as leaked homologous sequences, structures, and ligands are memorized by the probe. Controlling for homology with PLUG assesses the ability of the probe to generalize to unseen data. Error bars are 95% percentile intervals from 4000 bootstrap resampling of test proteins, assays, or pairs. for CAFA5 does not decompose into per protein scores so error bars are not reported.
Internal Layers can Demonstrate Varying Functional Representation
One way to improve protein function prediction models is through understanding where or why they excel and how they improve with scale. The last layer of a protein language model is not always the best for a given task. 73 We therefore used the multifaceted PLUG benchmark to test if different layers of ESM3 understand different aspects of function. We trained the same ridge and MLP probes on embeddings from every fourth layer using the Lo-Hi splits. Layer zero corresponds to the input embeddings before the first transformer block. We report only probe results, as the zero-shot performance requires the reconstruction head, which was only pretrained on the final layer (Figure 5).
Consistent with previous findings, most of the functional benchmarks reach their peak probe performance in later layers. 73 The majority of datasets (Megascale, FireProt, ProteinGym, SHS27K, AlloBench, PASSerRank, and ATLAS) improved steadily with depth, and the rate of improvement nearly tripled after layer 32. Notably, layer 32 is where ESM3 was shown to fuse its multimodal inputs into a unified representation. 73 CAFA5 followed a different pattern. Its performance rose steadily up to layer 32 and then plateaued, with peaks at layers 40 and 44.
The remaining benchmarks showed no clear layer preference. We attribute this to the weak signal that simple probes extract from these tasks, not to an absence of layer-specific structure. In both small molecule datasets, the ligand embedding is fixed across layers, which further dilutes the signal from the protein representation. Finally, we show that controlling for homology does not have a significant effect on the scaling results from PLM predictions (Figure S6).
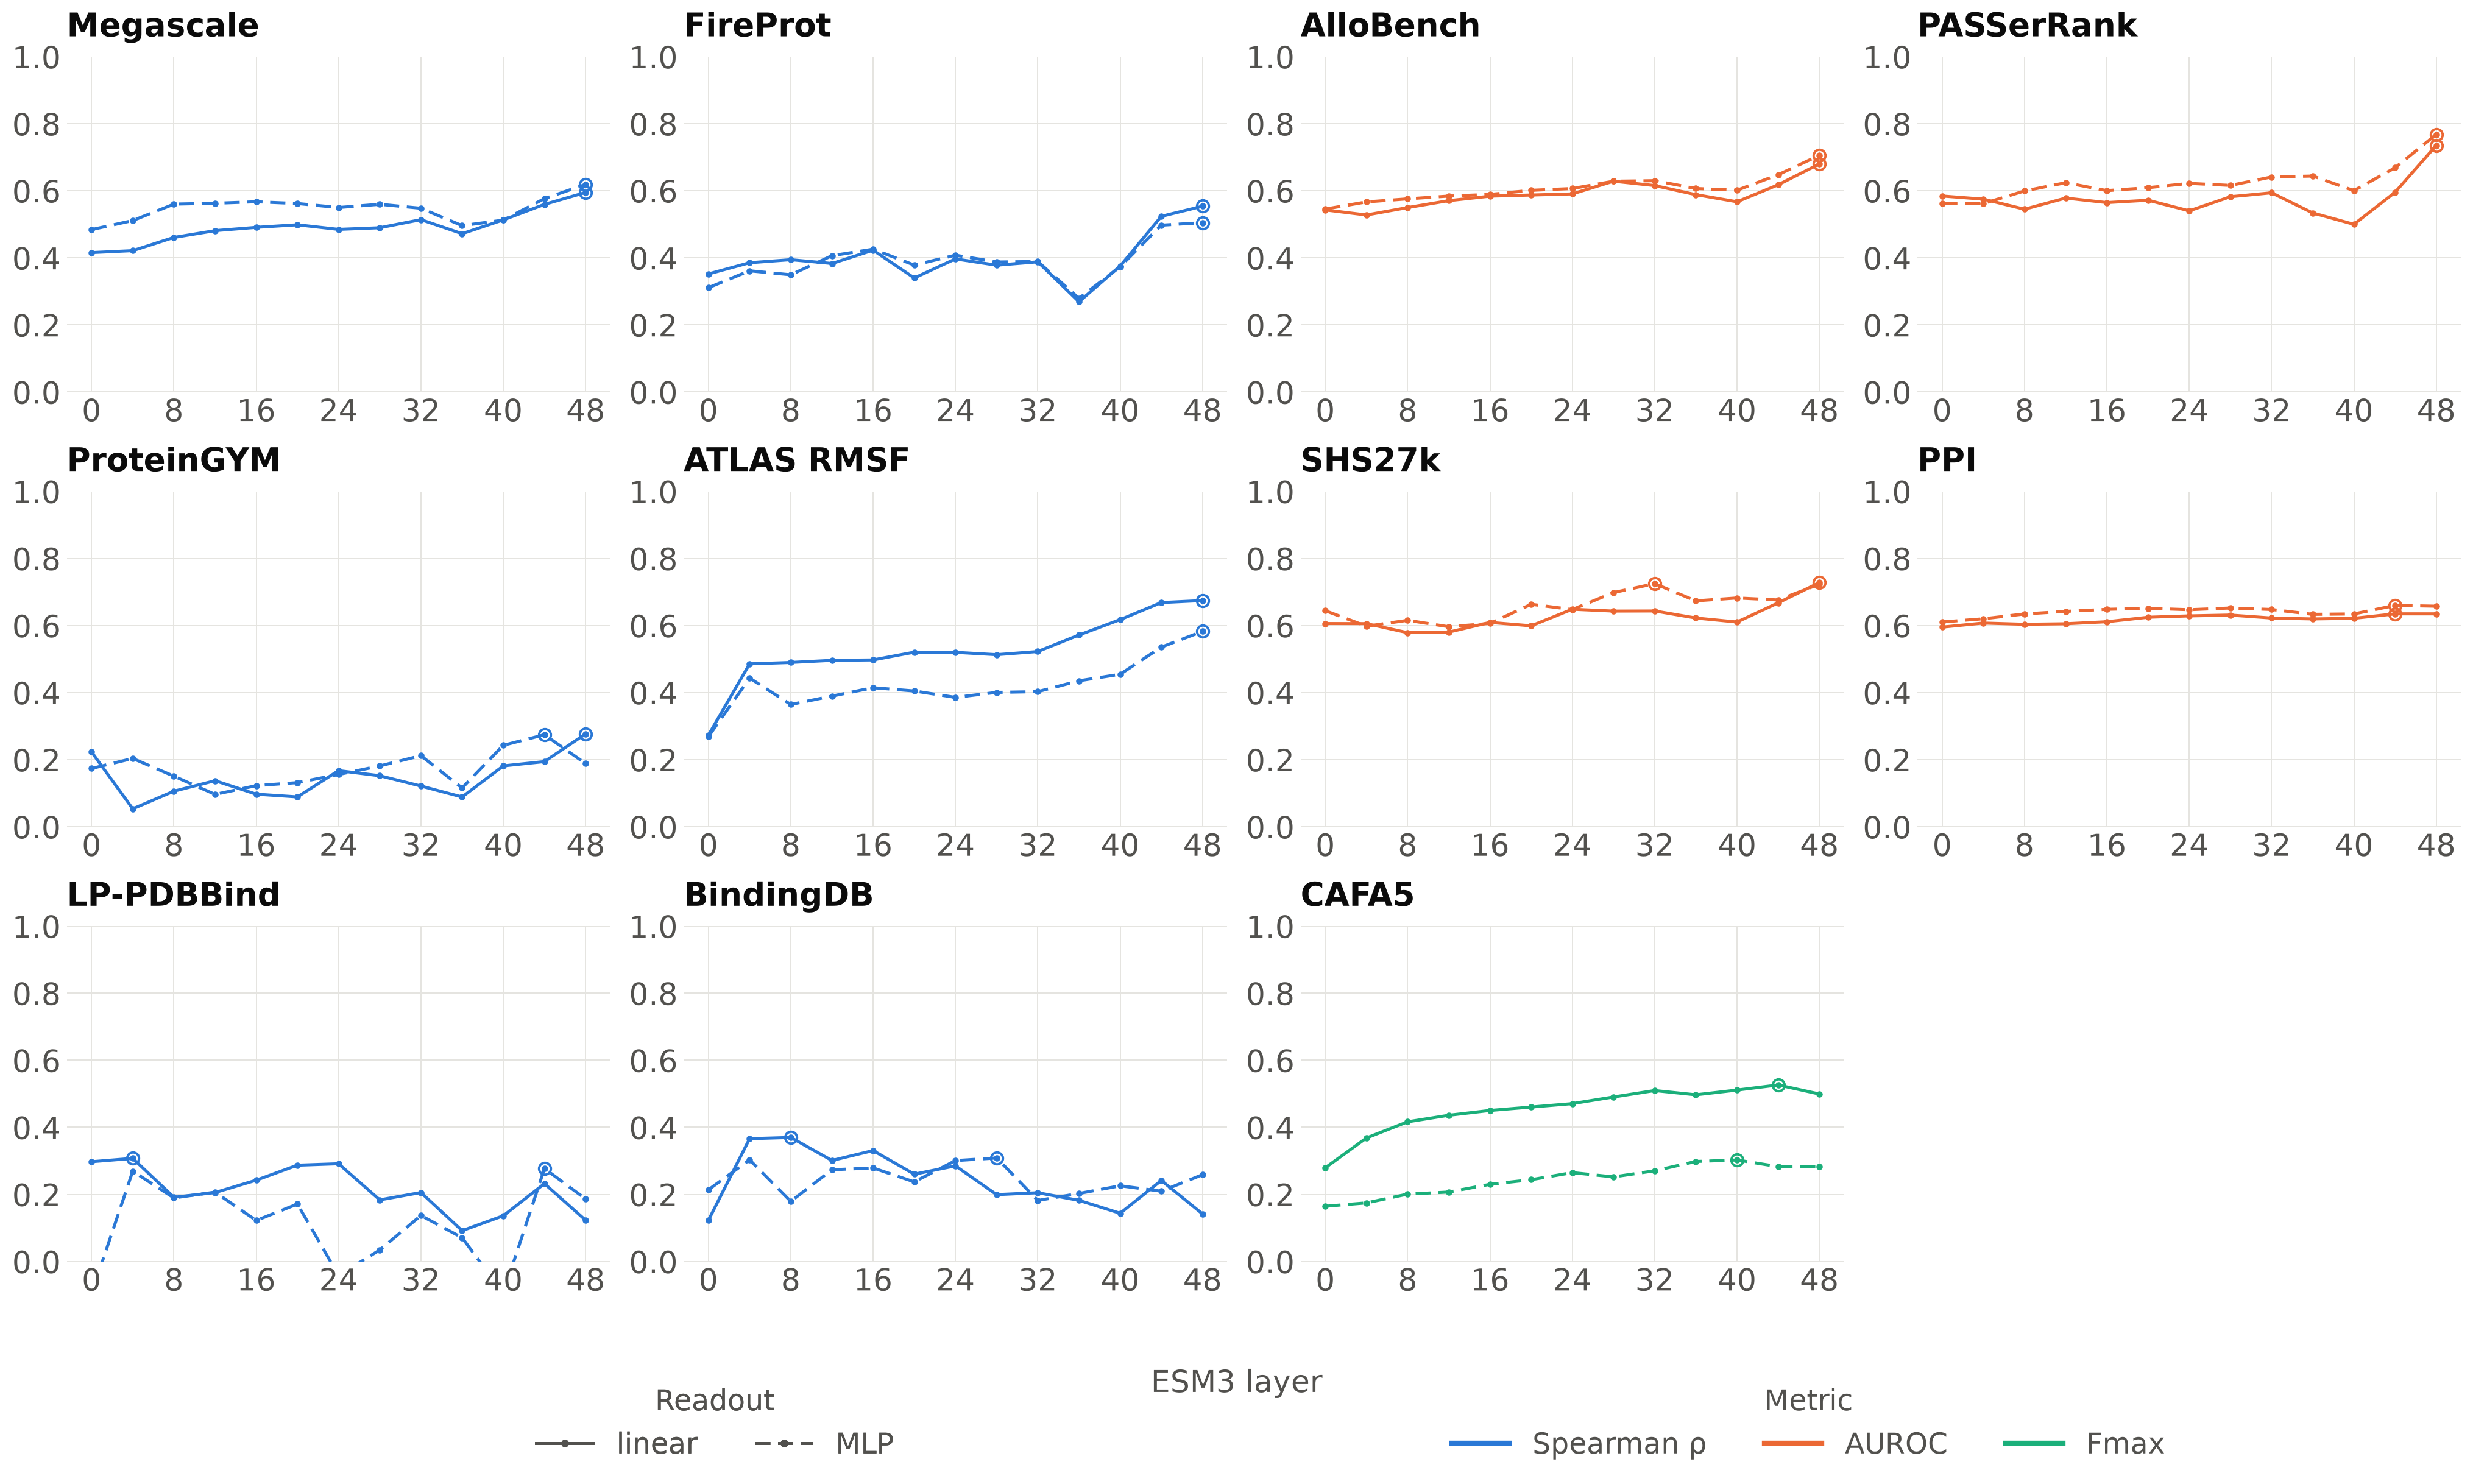
Figure 5. Layerwise performance of ESM3 on functional dataset. Embeddings extracted from every 4th layer of ESM3 are used to predict different functions using the splits generated with the Lo-Hi method. Later layers predict function best for the majority of datasets (Megascale, FireProt, ProteinGym, SHS27K, AlloBench, PASSerRank, and ATLAS), while others show less preference for a single layer.
Discussion
Predicting protein function has been a long-standing challenge in biology. Assessing our progress on this task is complicated by the fact that protein function is multidimensional. Evaluating functional prediction therefore requires testing across functional axes under the same leakage controls. PLUG is a framework that enables researchers to build and test diverse protein function predictors with strict data leakage standards across datasets. Across 11 datasets spanning granularities and modalities, PLUG homology splits reduced ESM3 probe performance by 25.9% for linear probes and 26.3% for MLP probes relative to matched random splits, indicating that random splits can substantially overestimate how well current PLMs generalize to unseen proteins.
The reduction in performance was not uniform across tasks. Tasks annotated at the level of whole proteins or families were most impacted by split, with 41–72% reductions for Lo-Hi MLP probes. 74 Allostery and gold-standard PPIs showed intermediate drops (15–21%), whereas stability and fitness dropped by 6–15%, and RMSF by only 2%. The gradient suggests that properties that depend on local sequence and structure, such as flexibility and stability, transfer better to unseen homologs, potentially through reusable motif pairs. 75
However, there are multiple other factors that also may also contribute to this gradient. First, we did not remove sequences that overlap with PLM pretraining data from our validation and test sets. 35 Greater overlap between the pretraining corpora and test set would inflate the apparent transferability of residue-level tasks. Additionally, our splits do not take into account position-based splitting which substantially reduces PLM performance on fitness prediction. 36 Generalizing functional predictions to underrepresented proteins and mutations must consider the specific granularity of the task, the degree of similarity to training sets, the alignment of pretraining and downstream objectives, as well as functional confounders that are ubiquitous in biological assays. 36, 76 For example, because PLMs optimize for natural sequences, an unnatural but beneficial mutation may be scored poorly. Fine tuning the model on a dataset where non-natural mutations have positive labels reshapes the latent around the smaller context of the fine tuning dataset. This method shows some success, but requires data from known mutations before predicting unknown mutations, therefore reducing the utility of the model.
PLUG is built to evolve. The framework can accept additional datasets, which it uses to generate supervised learning sets or corpora to withhold from PLM pretraining. We will continue to update its benchmark datasets and splits as new functional data become available, including datasets such as FLIP2 and data from emerging assays such as HT-MEK. 21, 30 PLUG is intentionally modular to encourage users to add their own datasets and select the splitting strategy best suited to the task. New datasets need only a class in the codebase that parses the raw data before rerunning the splitting method or unlabeled pretraining screen. As no single threshold protects against all forms of leakage, we recommend that users generate splits at multiple thresholds and interpret model performance across all of them. This analysis shows the many ways a model can memorize its training set or overfit to a single or off-target objective.
While PLUG provides a useful test bed for training and evaluating protein function models, we acknowledge that it does not control for every type of data leakage. For example, many enzymes have different sequences and overall folds, but share common binding pocket scaffolding. In this case a model could memorize that a certain binding pocket shape or sequence maps to a certain activity. Data leakage can also occur based on residue position. 36 Future work will address these and similar limitations by continually adding datasets and similarity measures that capture relevant biological mechanisms.
A single model for general protein function will likely learn a foundational representation that is broadly predictive and/or be trained and evaluated on sufficiently diverse, sizable functional datasets. The former approach is susceptible to data leakage between pretraining data and evaluation homologs and the latter is constrained by the limited overlap and scale of high quality functional labels across the vast protein landscape. PLUG represents an effort to alleviate two critical roadblocks in the development of functional predictors: the broad definitions of protein function and pervasive data leakage. To help support community wide assessment, we have set up a Hugging Face challenge and aim to engage the community through submissions of new predictions. (https://huggingface.co/spaces/PrismScienceOrg/PLUG-challenge)
Methods
PLUG datasets
We gathered datasets from the literature for seven different functional axes. We chose these datasets to cover different definitions of function commonly used in the literature and to span a range of data modalities. Each benchmark is accessed through a public online server, and scripts are provided to download and rebuild each set. 2, 22–23, 29, 39, 43–45, 47–48, 55–56, 77
Similarity Measures
In practice, the similarity metrics take a few forms across benchmarks. The simplest case are datasets where the datapoint is represented by a single, wild-type protein sequence (Megascale, CAFA5, and ProteinGym). The main form of leakage in this case is single sequence similarity to other wild-type proteins. For this work, we chose a standard protein sequence comparison tool, MMseqs2, 58 which efficiently compares bulk sets of sequences with varying thresholds. Sequences are considered to be homologous if their ID is above 0.3 with greater than 0.8 coverage in either direction. This is a standard threshold which balances detection of remote homologs with the alignment artifacts that begin to arise in the so-called twilight zone of sequence IDs. 78 Wild type sequences are compared for mutation based datasets and the number of mutant measurements is used as the weight for split assignment.
If a dataset provides protein sequence and structure (ATLAS, AlloBench, PASSerRank, FireProt and LP-PDBBind), then the same item has two representations, and therefore two modes of data leakage, sequence and structure. We used TM-score from Foldseek which aligns the structures before scoring the residue distances, and is less sensitive to local differences and outliers. The traditional value distinguishing similar fold families is 0.5, but this lower threshold in combination with sequence similarity can transitively link most nodes into a large component that can not be split. At a TM-score of 0.5, 98.1% of ATLAS nodes become linked with a structure edge. In an analysis of a SCOP database, two proteins with a TM-score of 0.5 had a 13% chance of being from the same fold family, compared to 90% when the score increased to 0.7. 59 To compare structures, we use the TM-score with a threshold of > 0.7 to indicate homologous folds.
Finally, some datasets include ligands (LP-PDBBind, BindingDB). To identify similar ligands we used ECFP4 Tanimoto similarity threshold of 0.5 (under the Morgan fingerprint). 61
Splitting PLUG datasets
Adapted Lo-Hi balanced vertex minimum k cut splitter
Let be the set of data points and be the set of modalities (i.e. protein, ligand) in a benchmark. Then let be the set of entities of modality that datapoint contains. For example, contains single protein sequences for CAFA5, two proteins in SHS27K, and a protein–ligand pair in BindingDB. The pooled undirected graph is constructed for each modality (i.e., protein or ligand) where the set of edges are defined when a similarity is above a threshold, , for each feature, (i.e. sequence, structure, Tanimoto):
Components that fit within a split are greedily assigned to the split, , which is furthest from its fractional share subject to a tolerance, . The nodes of components which can not be dealt whole are reduced to clusters, . The clusters are then assigned to a split or dropped by . A decision variable, , is defined as if cluster is assigned to split and otherwise. Each cluster must be assigned to exactly one split or dropped. Retention can then be defined as the datapoint weighted sum of proteins over all splits and datapoints, where is the number of datapoints that would be partitioned if cluster was placed in split . Thus the problem is formulated as:
subject to split fractions:
cluster assignment:
edge constraints:
and a datapoint floor:
With for train, validation, and test sets. is the number of proteins in single protein datasets and the number of interactions for paired datasets.
Finally, if the data lends itself to classes that should not be unevenly dealt (such as the assay types in the ProteinGym benchmark) the stratification constraint is applied for classes, :
where is a user defined stratification tolerance.
Baseline evaluations
For the Megascale, FireProt and ProteinGym zero-shot predictions, the wild-type sequence was masked at the mutant site and passed through the model. The log-likelihood ratio from mutant to wild-type residues was used as the predicted fitness label, summed over multiple sites for mutations. For the linear and MLP tracks, the wild-type and mutant sequences were each passed through the model and embeddings were mean pooled over the residues, resulting in protein level features. The differences between the two protein embeddings (mutant - wild-type) and their Hadamard product were concatenated into a single vector before being passed to a ridge regression model or a simple MLP. 79 The Spearman was computed within each test wild-type protein with at least three variants and averaged, weighted by the number of variants.
For ProteinGym a separate model was fit per assay type, following the established procedure to avoid the model memorizing the assay label scales. 29 Spearman was calculated for each assay with at least three variants and then averaged across all assays sharing a UniProt ID. Those per protein means were then averaged within each assay type (binding, activity, expression, organismal fitness, stability) and then combined into one final correlation with equal weight, again following the established method.
For the gold standard PPI and SHS27K zero-shot predictions, the absolute difference in the z-score of the two proteins’ mean log likelihoods was used as the zero-shot score for binding. For the linear and MLP tracks, both sequences were passed through the encoder and embeddings were mean pooled over the residues, resulting in protein-level features. The differences between the two entities embeddings (absolute difference for PPIs) and their Hadamard product were concatenated into a single vector before being passed to a logistic (single regression for PPI and one per interaction term for SHS27K) and a single or multi-label MLP classifier.
For LP-PDBBind and BindingDB zero-shot predictions, the absolute difference in the z-score of the log likelihoods between the sequence and ligand was used as the binding prediction. For the linear and MLP tracks the embeddings from each model are first projected into a 256 dimension space to account for shape mismatch. The original embeddings are then concatenated with the absolute differences and Hadamard products between the projected vectors before being passed to ridge regression or MLP.
For the ATLAS RMSF, AlloBench, and PASSerRank zero-shot predictions, the log-likelihood of the residue was used to predict its label. For the linear and MLP tracks, the sequence was passed through the model and embeddings were extracted at the residue level. These per-residue embeddings were used as features to the ridge or logistic and simple MLP models. Because RMSF scales vary per protein and allosteric site density correlates with length, we score predictions per protein and report the average score across all proteins.
For the CAFA5 GO zero-shot predictions, the average log-likelihood of the sequence was min-max scaled across the whole dataset and then used as the score for each GO term in the dataset. For the linear and MLP models, the embeddings were mean-pooled over the residues. Each of the ontology branches was considered separately and only GO terms with 20 positive labels in the dataset were scored. The sequence-level features were then passed to one logistic regressor per term and an MLP for multi-label classification over all GO terms in the dataset. The was calculated per GO branch and averaged. For all ridge regression, the alpha parameter was swept over 7 values (1e0 to 1e6) on the validation dataset then the model is refitted on train and validation. The MLPs were single hidden layer models with dimension 256 (ReLU, dropout 0.1), trained with Adam (lr of 1e-3) with early stopping on the validation set. Calculations are reported as Spearman’s throughout the regression tasks.
The two splitting strategies are compared paired with a randomly sampled control that splits the same proteins to random splits only considering exact sequence matches. Up to 4000 random re-deals are evaluated with the zero-shot scoring (fewer for the larger datasets) and the sample with the closest zero-shot score to the method is kept. The change in performance from random control splits to method splits is calculated with the following equation, with chance performance taken as 0.5 for AUROC, 0 for Spearman, and 0 for .
Layerwise Analysis and Scaling
To evaluate whether the performance was different for the layers of ESM3, we scored the same frozen model and tuned probe on embeddings extracted from every 4th layer. The probes were trained and predictions were evaluated exactly as previously described. The 0th layer represents the initial untrained projection from the encoder head before it is passed to the trunk. Ligand representations from SMILES embeddings were not swept over the layers before combining with the protein embeddings from each layer.
To test whether scaling was affected by the splitting strategies, we benchmarked 5 different sizes of ESM2 (8M, 35M, 150M, 650M, and 3B) on Megascale and ATLAS using a linear probe trained on frozen embeddings.
Acknowledgements
This work was supported by Radial, a division of Astera Institute (https://ror.org/050rbg919). This material is based upon work supported by the Defense Advanced Research Projects Agency under this Agreement (SAW and BC received research support). The views and conclusions contained in this document are those of the authors and should not be interpreted as representing the official policies, either expressed or implied, of the U.S. Government. We thank Ziyue Zou for insightful suggestions pertaining to the incorporation of ligand datasets and small molecule models.
Supplemental
Benchmark Statistics and Overlap
Protein fitness comes from ProteinGym which has internal functional variance for binding (n=12 proteins, 751,063 labels), activity (n=40 proteins, 447,319 labels), expression (n=18 proteins, 97,869 labels), organismal fitness (n=65 proteins, 1,034,722 labels), and stability (n=66 proteins, 134,794 labels). 29 Six proteins are assayed for both activity and expression, four proteins are assayed for binding and expression, three are assayed for activity and organismal fitness, and one is assayed for both expression and organismal fitness. Mutational folding stability is accessed via the Megascale and FireProt databases as described in the ThermoMPNN paper, which applied filtering for single substitution mutations and wild-type structural fidelity. 22, 47–48 Megascale comprises 298 wild-type proteins to which mutations are made and 271,231 stability measurements are recorded. FireProt, similarly filtered to reduce duplicates and errors in the paper, consists of 3,404 measurements of mutational stability to 100 unique wild-type proteins. For the PPI datasets, the gold standard set is a binary interaction benchmark (n proteins=11,019; n protein-pairs=274,500); positive pairs are composed of experimentally detected human interactions drawn from assays such as yeast two-hybrid and affinity-purification mass spectrometry then weighted by the supporting evidence. 23 The negatives are protein pairs with no reported interaction, sampled to balance the positives. STRING’s SHS27K (n proteins=1,690 unique sequences and n protein-pairs=7,624), scores protein pairs by combining experimental data, curated databases, co-expression, genomic context, and automated text-mining of the literature. 56–57 Allostery is included from the AlloBench and PASSerRank datasets. Both assign ‘allosteric site’ labels to residues based on the AlloSteric Database’s (ASD) manual literature curation via PubMed, US patent, and European Patent literature search for proteins with at least 3 pieces of experimental allosteric evidence. 44–46 AlloBench is a pipeline produced by integrating the AlloSteric Database, UniProt, the Mechanism and Catalytic Site Atlas, and the PDB. 9, 80–81 PASSerRank is a prediction model of allosteric sites, taking positives from ASD. The AlloBench and PASSerRank datasets apply their own filtering criteria and additional label collection on top of ASD. As such, the two datasets overlap substantially, yielding 479 total unique sequences and 1,738 and 1,375 unique allosteric site records, respectively. Small-molecule binding data are sourced from BindingDB and LP-PDBBind, which represent a collected set of protein-ligand binding labels spanning EC50, IC50, Kd, and Ki values. 39, 43 While these values are not identically comparable, we treat them as general measures of binding strength and thus report evaluations using ranking procedures (Spearman correlation) instead of raw linear correlation, following recent approaches. 82 BindingDB is a decades-long organization of experimental binding data from literature and patents. 77 Initially tailored towards medicinal chemistry, it now contains 2.9 million binding measurements between different biopolymers. 43, 77 Here, we focus on protein–ligand interactions. LP-PDBBind (Leak-Proof PDBbind) is a re-curation of PDBbind that seeks to create leak proof splits by iteratively breaking off clusters scored by chemical Dice similarity 83 and sequence similarity after Needleman-Wunsch alignment. 84 BindingDB and LP-PDBBind contain 2,156 and 12,718 unique protein sequences with 41,027 and 15,477 unique SMILES strings, respectively. BindingDB and LP-PDBBind, which contain large collections of medicinal chemistry campaigns testing many ligands against a drug target, yield 76,866 (50,571 IC50, 21,968 Ki, 2,332 Kd, and 1,995 EC50) and 19,443 (7,190 IC50, 5,004 Ki, and 7,249 Kd) labeled interactions, respectively. ATLAS is a database of triplicate 100-nanosecond explicit-solvent MD simulations of 1,938 high-resolution crystal structures from 1,693 unique sequences. 55 The RMSFs of each residue in each protein are provided to indicate the short-timescale dynamics of the proteins.
Table S1. Percent of sequences removed after screening a 1 million sequence sample of UniRef90 for homologs.
| Benchmark/ID | 20% | 30% | 40% | 50% |
|---|---|---|---|---|
| ATLAS | 9.03 | 4.13 | 2.15 | 1.04 |
| AlloBench | 4.28 | 1.94 | 0.99 | 0.53 |
| BindingDB | 7.95 | 3.97 | 2.16 | 1.13 |
| CAFA5 | 15.00 | 7.21 | 3.80 | 2.09 |
| FireProt | 1.18 | 0.57 | 0.23 | 0.12 |
| LP-PDBBind | 17.23 | 8.94 | 4.93 | 2.65 |
| Megascale | 3.65 | 1.13 | 0.48 | 0.29 |
| PASSerRank | 3.56 | 1.58 | 0.77 | 0.39 |
| PPI | 22.55 | 12.45 | 7.75 | 4.75 |
| ProteinGym | 2.65 | 1.10 | 0.57 | 0.30 |
| SHS27K | 7.22 | 3.38 | 1.94 | 1.12 |
| All | 38.50 | 21.50 | 13.12 | 7.96 |
Table S2. Change in performance on homology splits compared to size matched random sampled splits and chance prediction.
| Benchmark | DataSAIL Linear | DataSAIL MLP | Lo-Hi Linear | Lo-Hi MLP |
|---|---|---|---|---|
| ATLAS | -12.3% | -7.1% | +8.5% | -2.0% |
| AlloBench | +0.1% | +0.6% | -8.7% | -7.4% |
| BindingDB | -36.4% | -65.4% | -65.5% | -41.8% |
| CAFA5 | -37.1% | -41.0% | -31.0% | -41.0% |
| FireProt | -3.3% | +3.8% | +3.7% | -5.9% |
| LP-PDBBind | -43.6% | -42.7% | -82.3% | -72.3% |
| Megascale | -7.8% | -11.9% | -14.9% | -15.1% |
| PASSerRank | -1.4% | -2.4% | -6.3% | -7.5% |
| PPI | -7.2% | -7.9% | -4.4% | -4.0% |
| ProteinGym | +42.0% | -7.5% | +4.3% | -8.3% |
| SHS27K | -29.8% | -27.3% | -21.2% | -22.3% |
| All | -12.4% | -19.0% | -19.8% | -20.7% |
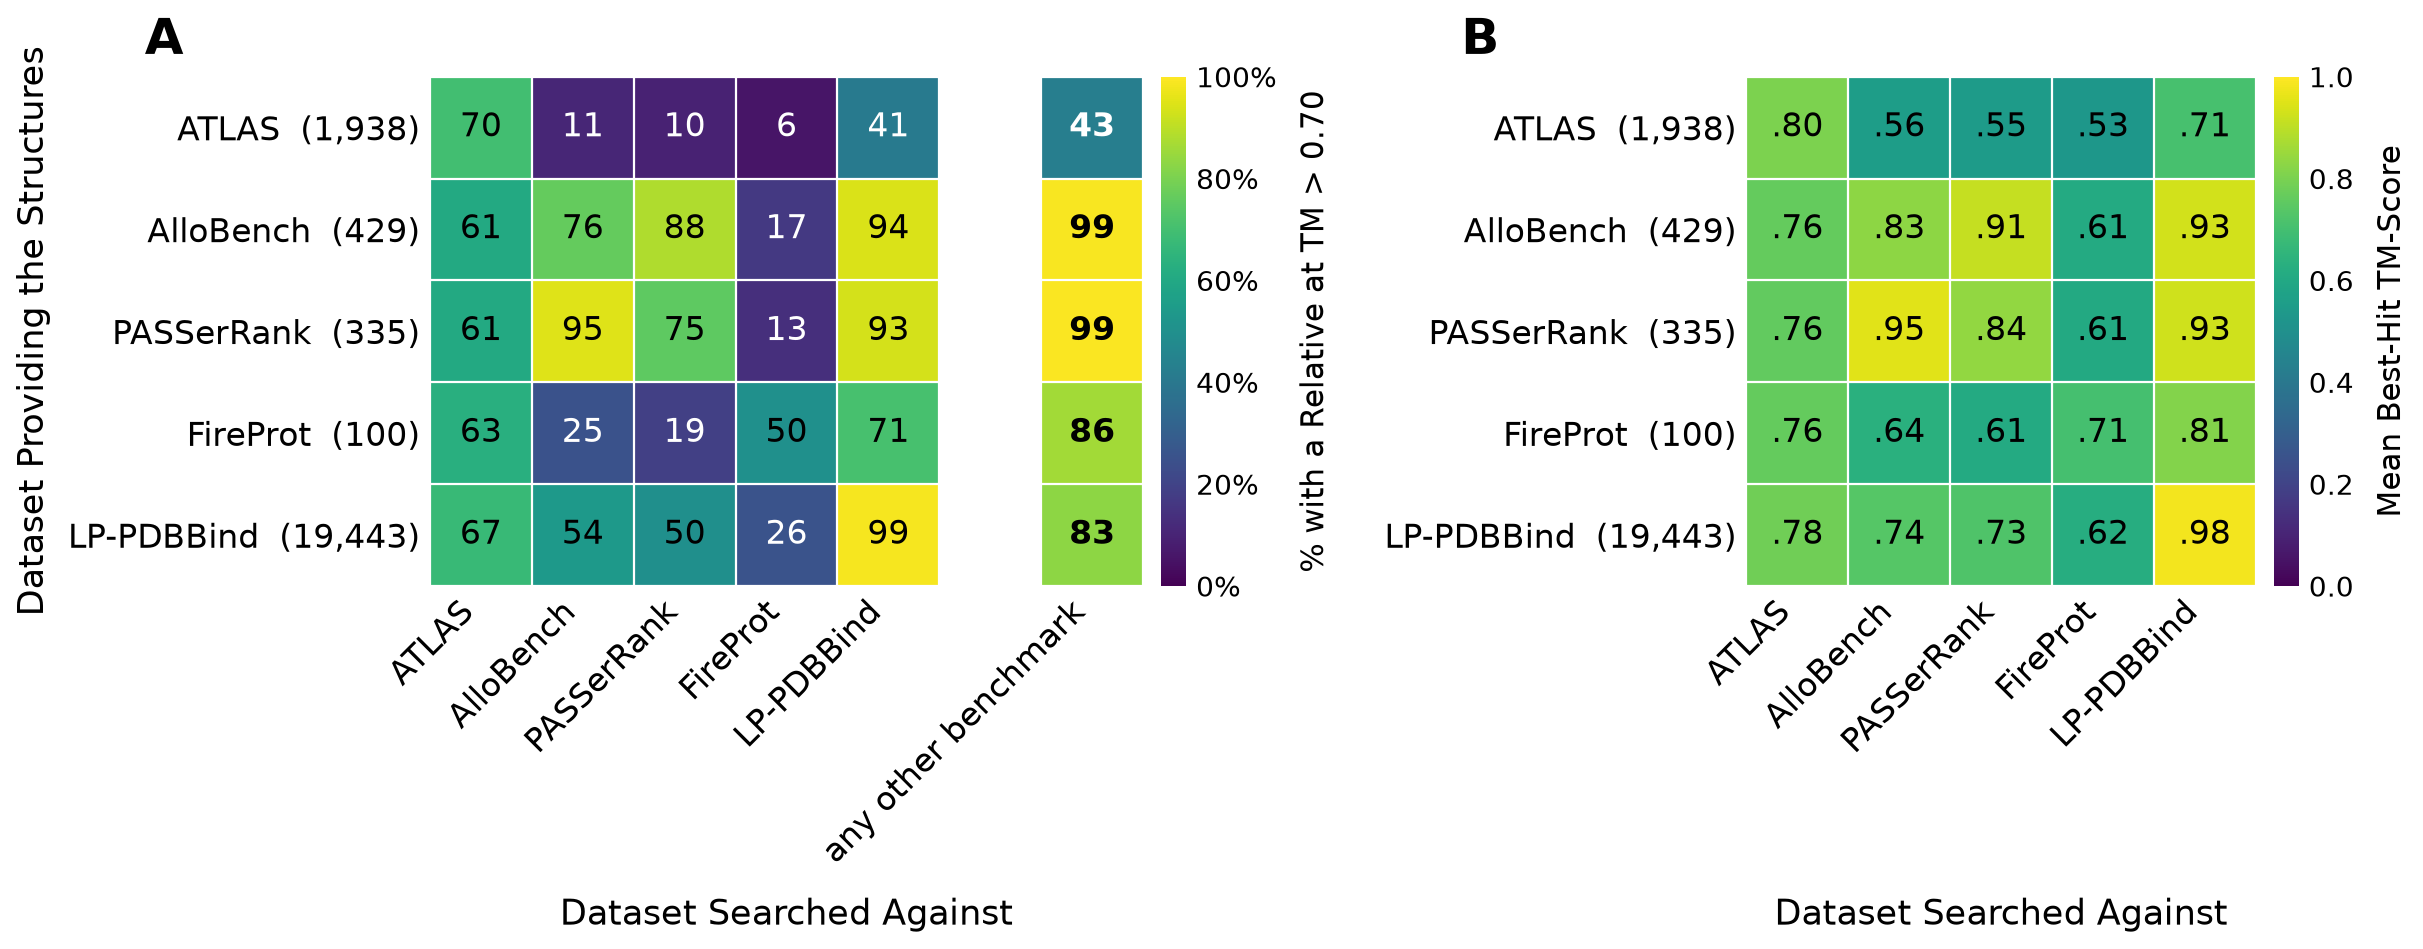
Figure S1. Structural overlap comparisons analogous to sequence overlap characterization for ATLAS, AlloBench, PASSerRank, FireProt, and LP-PDBBind.
(A) Percent of the row datasets' entities with a TM-score above 0.7 to any structure in the column dataset.
(B) Mean best-hit TM-score between all proteins in the corresponding datasets.
Homology splitting with DataSAIL
DataSAIL is a method to minimize the leakage across splits in a dataset. DataSAIL differs from PLUG in its objective and constraints but seeks to achieve the same goal: generating homology splits to prevent data leakage in evals. DataSAIL clusters the items into a similarity graph and then collapses to a defined number of clusters using agglomerative or spectral clustering (we reduced it to 1000 clusters per dataset). The method defines a quantity called leakage, which is the total similarity between two sets of items, as the objective function to minimize. Additionally, the method sets an upper bound constraint on the deviation from the split fraction. DataSAIL is run on MMseqs2 identity only; structural similarity is not controlled in the DataSAIL splits. For protein–ligand datasets, DataSAIL’s two dimensional mode could not meet the split sizes because one ligand cluster holds 84% (BindingDB) and 69% (LP-PDBBind) of the datapoints. We therefore run the method in S1 mode on the proteins and assign each ligand to the split containing most of its rows, dropping ligands whose Tanimoto neighbors fall in another split. To make the spectral clustering step reproducible, we fix the seed of the ARPACK solver and are able to return reproducible splits. We use DataSAIL’s default parameters where possible (=0.05, =0.15, SCIP solver, 80/10/10 splits), matching the Lo-Hi constraints.
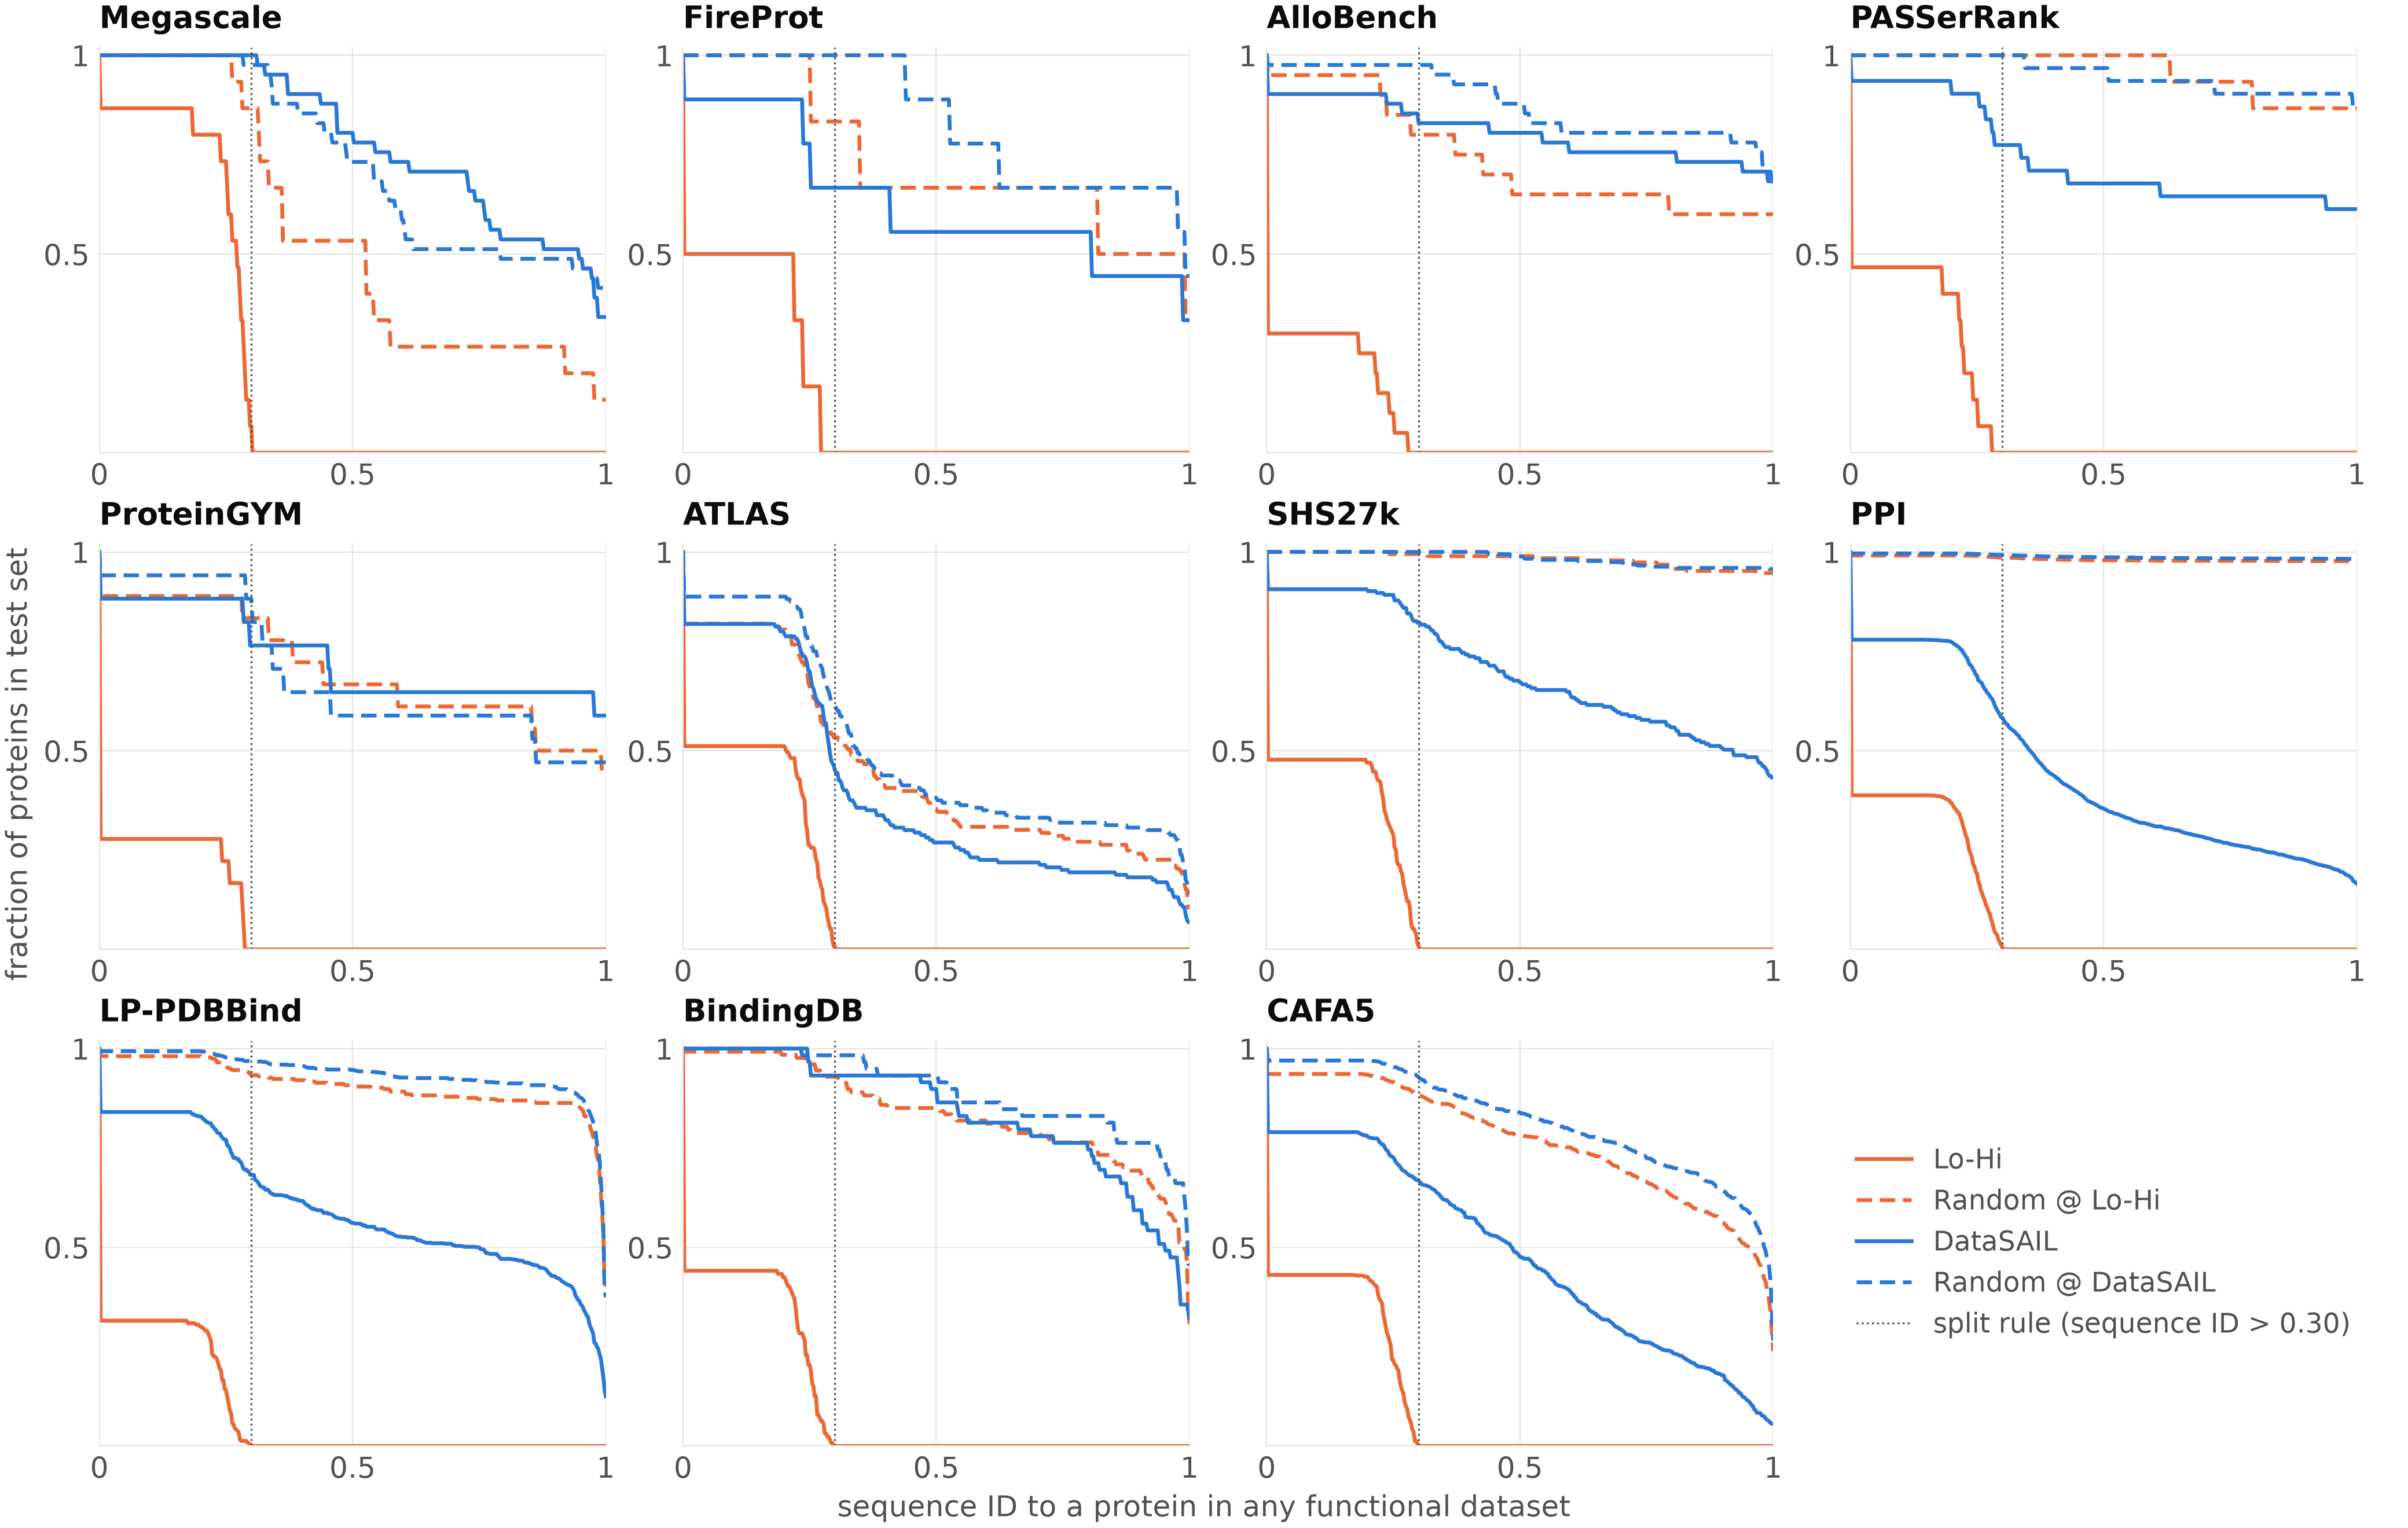
Figure S2. Sequence identities of each dataset’s test proteins to their nearest training protein in any of the eleven datasets using Lo-Hi, DataSAIL, and their size-matched random controls. Curves show the fraction of test proteins whose nearest homolog is at least the identity on the x axis. The dotted line marks the 30% ID threshold used to split Lo-Hi.
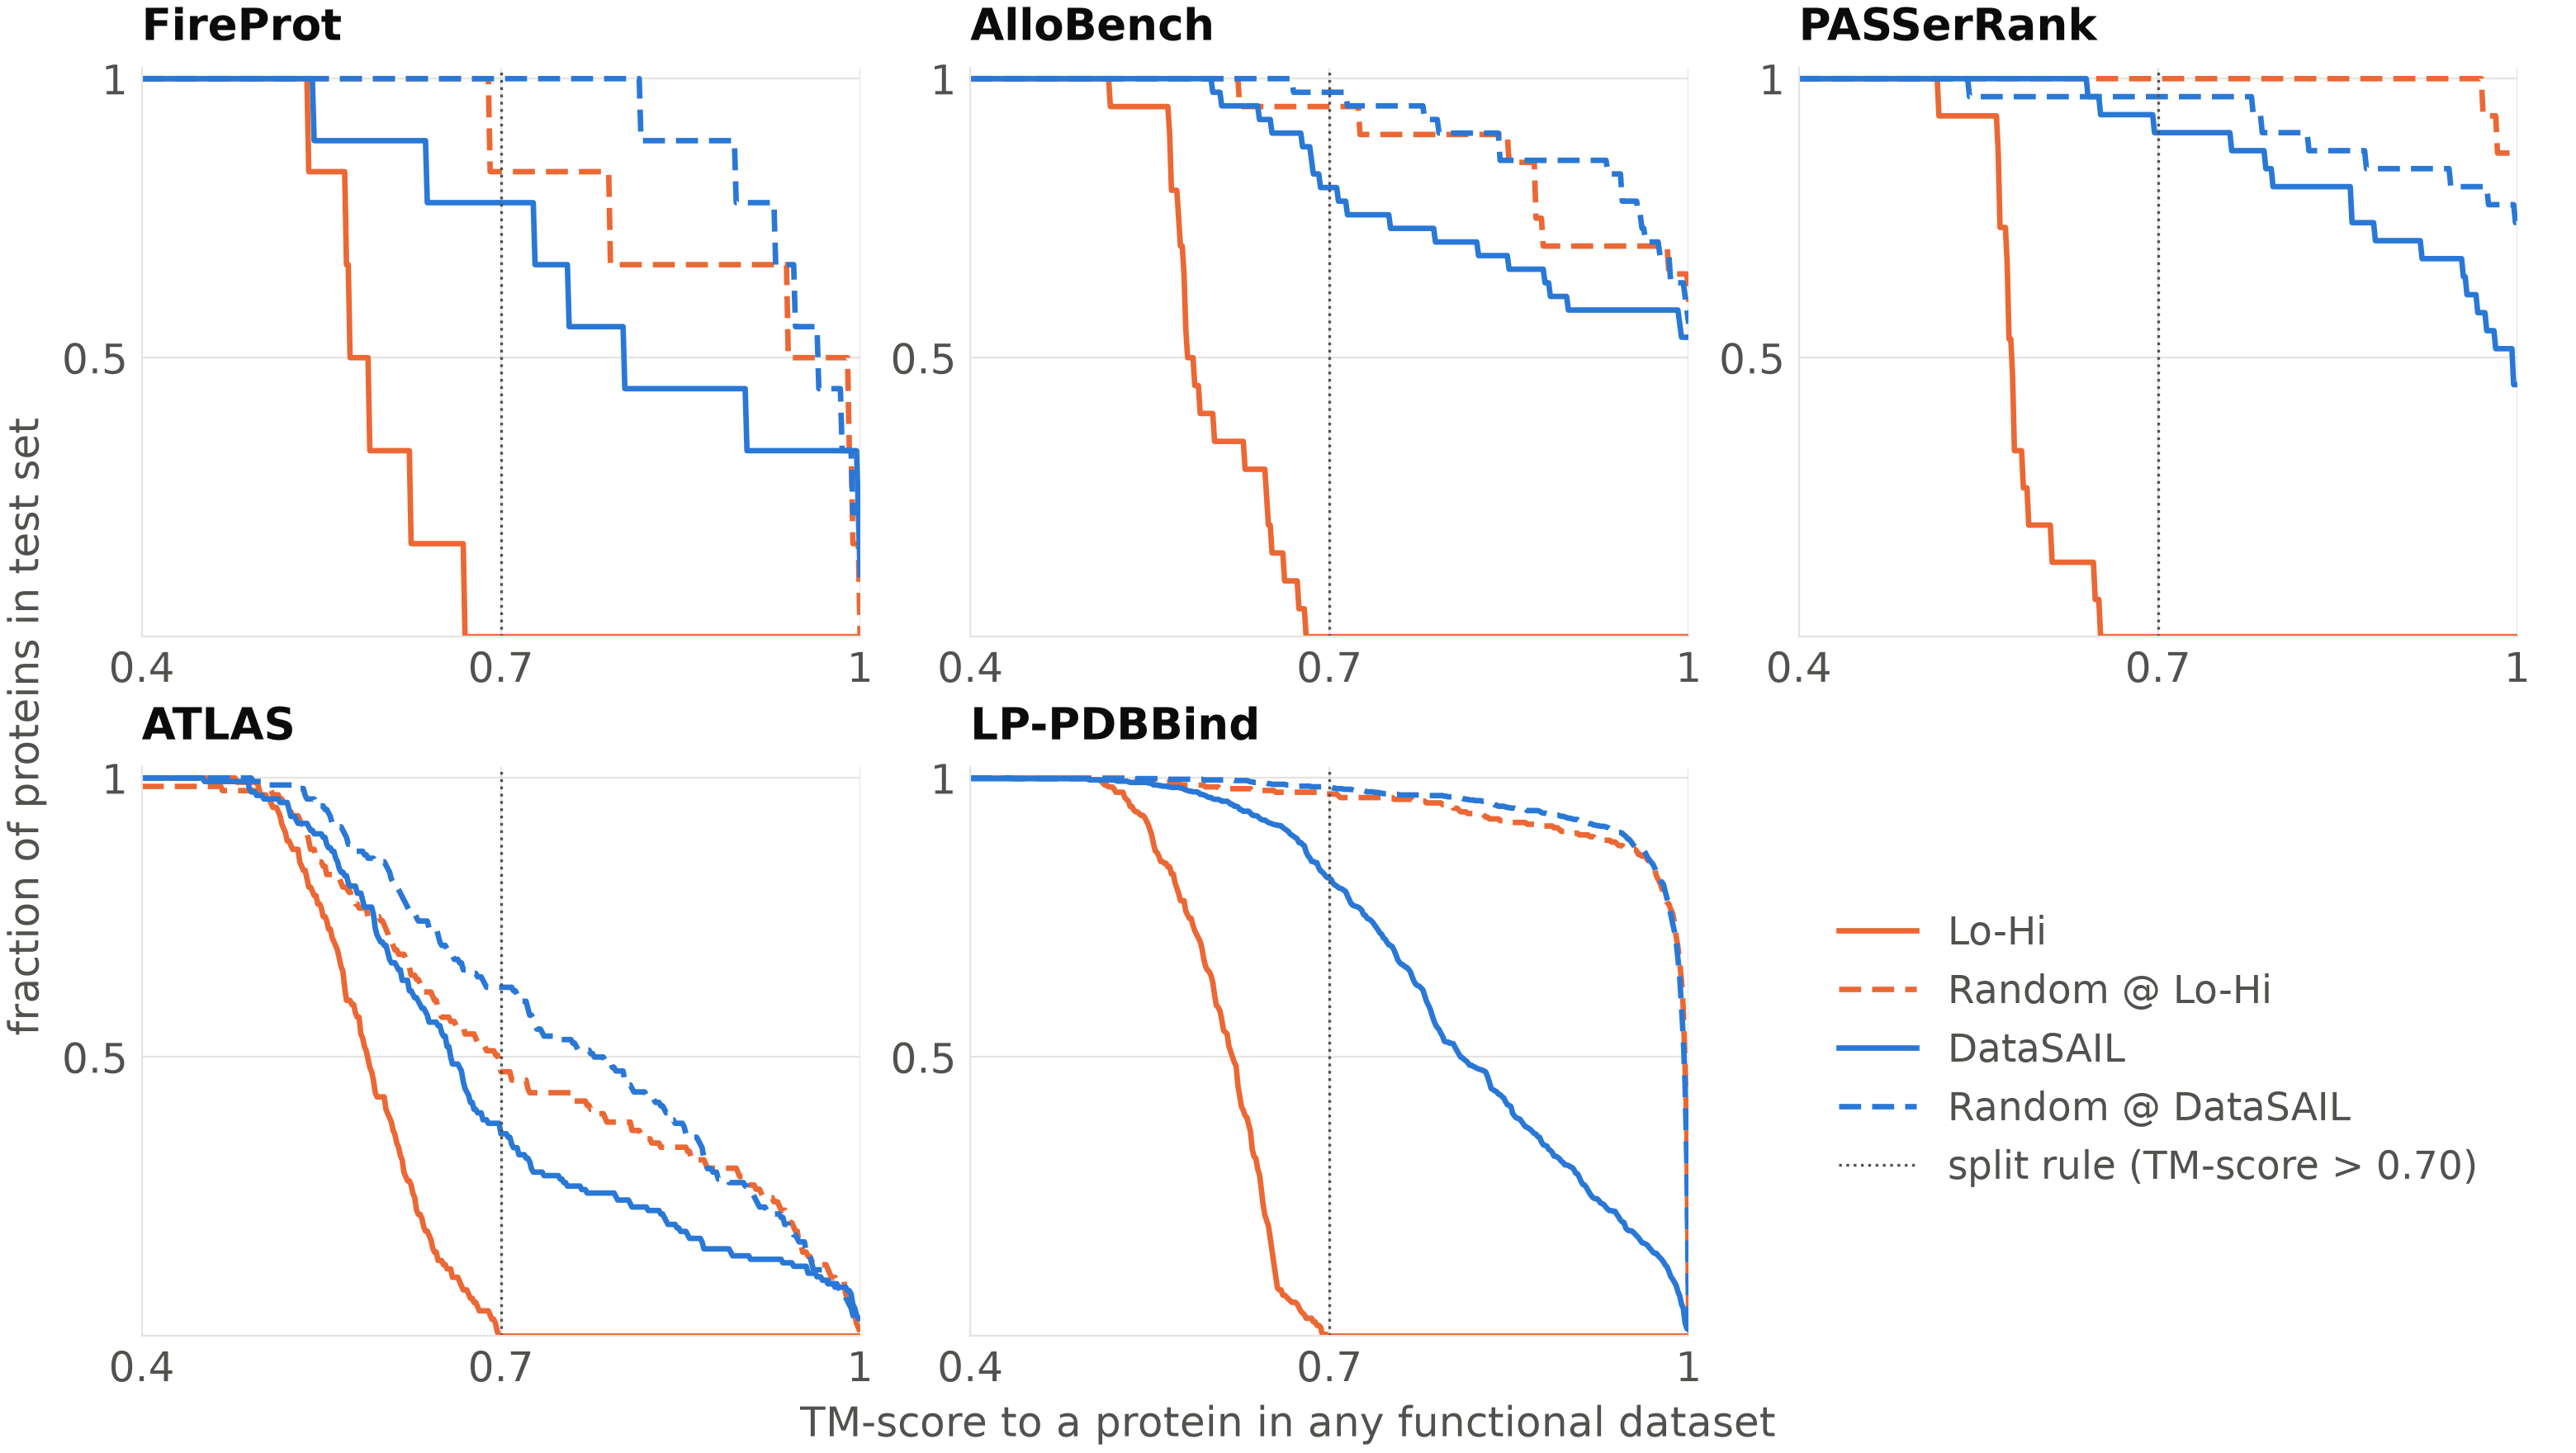
Figure S3. TM-score of ATLAS, AlloBench, PASSerRank, FireProt, and LP-PDBBind test sets to the nearest training structure in any of those datasets. The dotted line illustrates the leakage cutoff used when splitting with Lo-Hi.
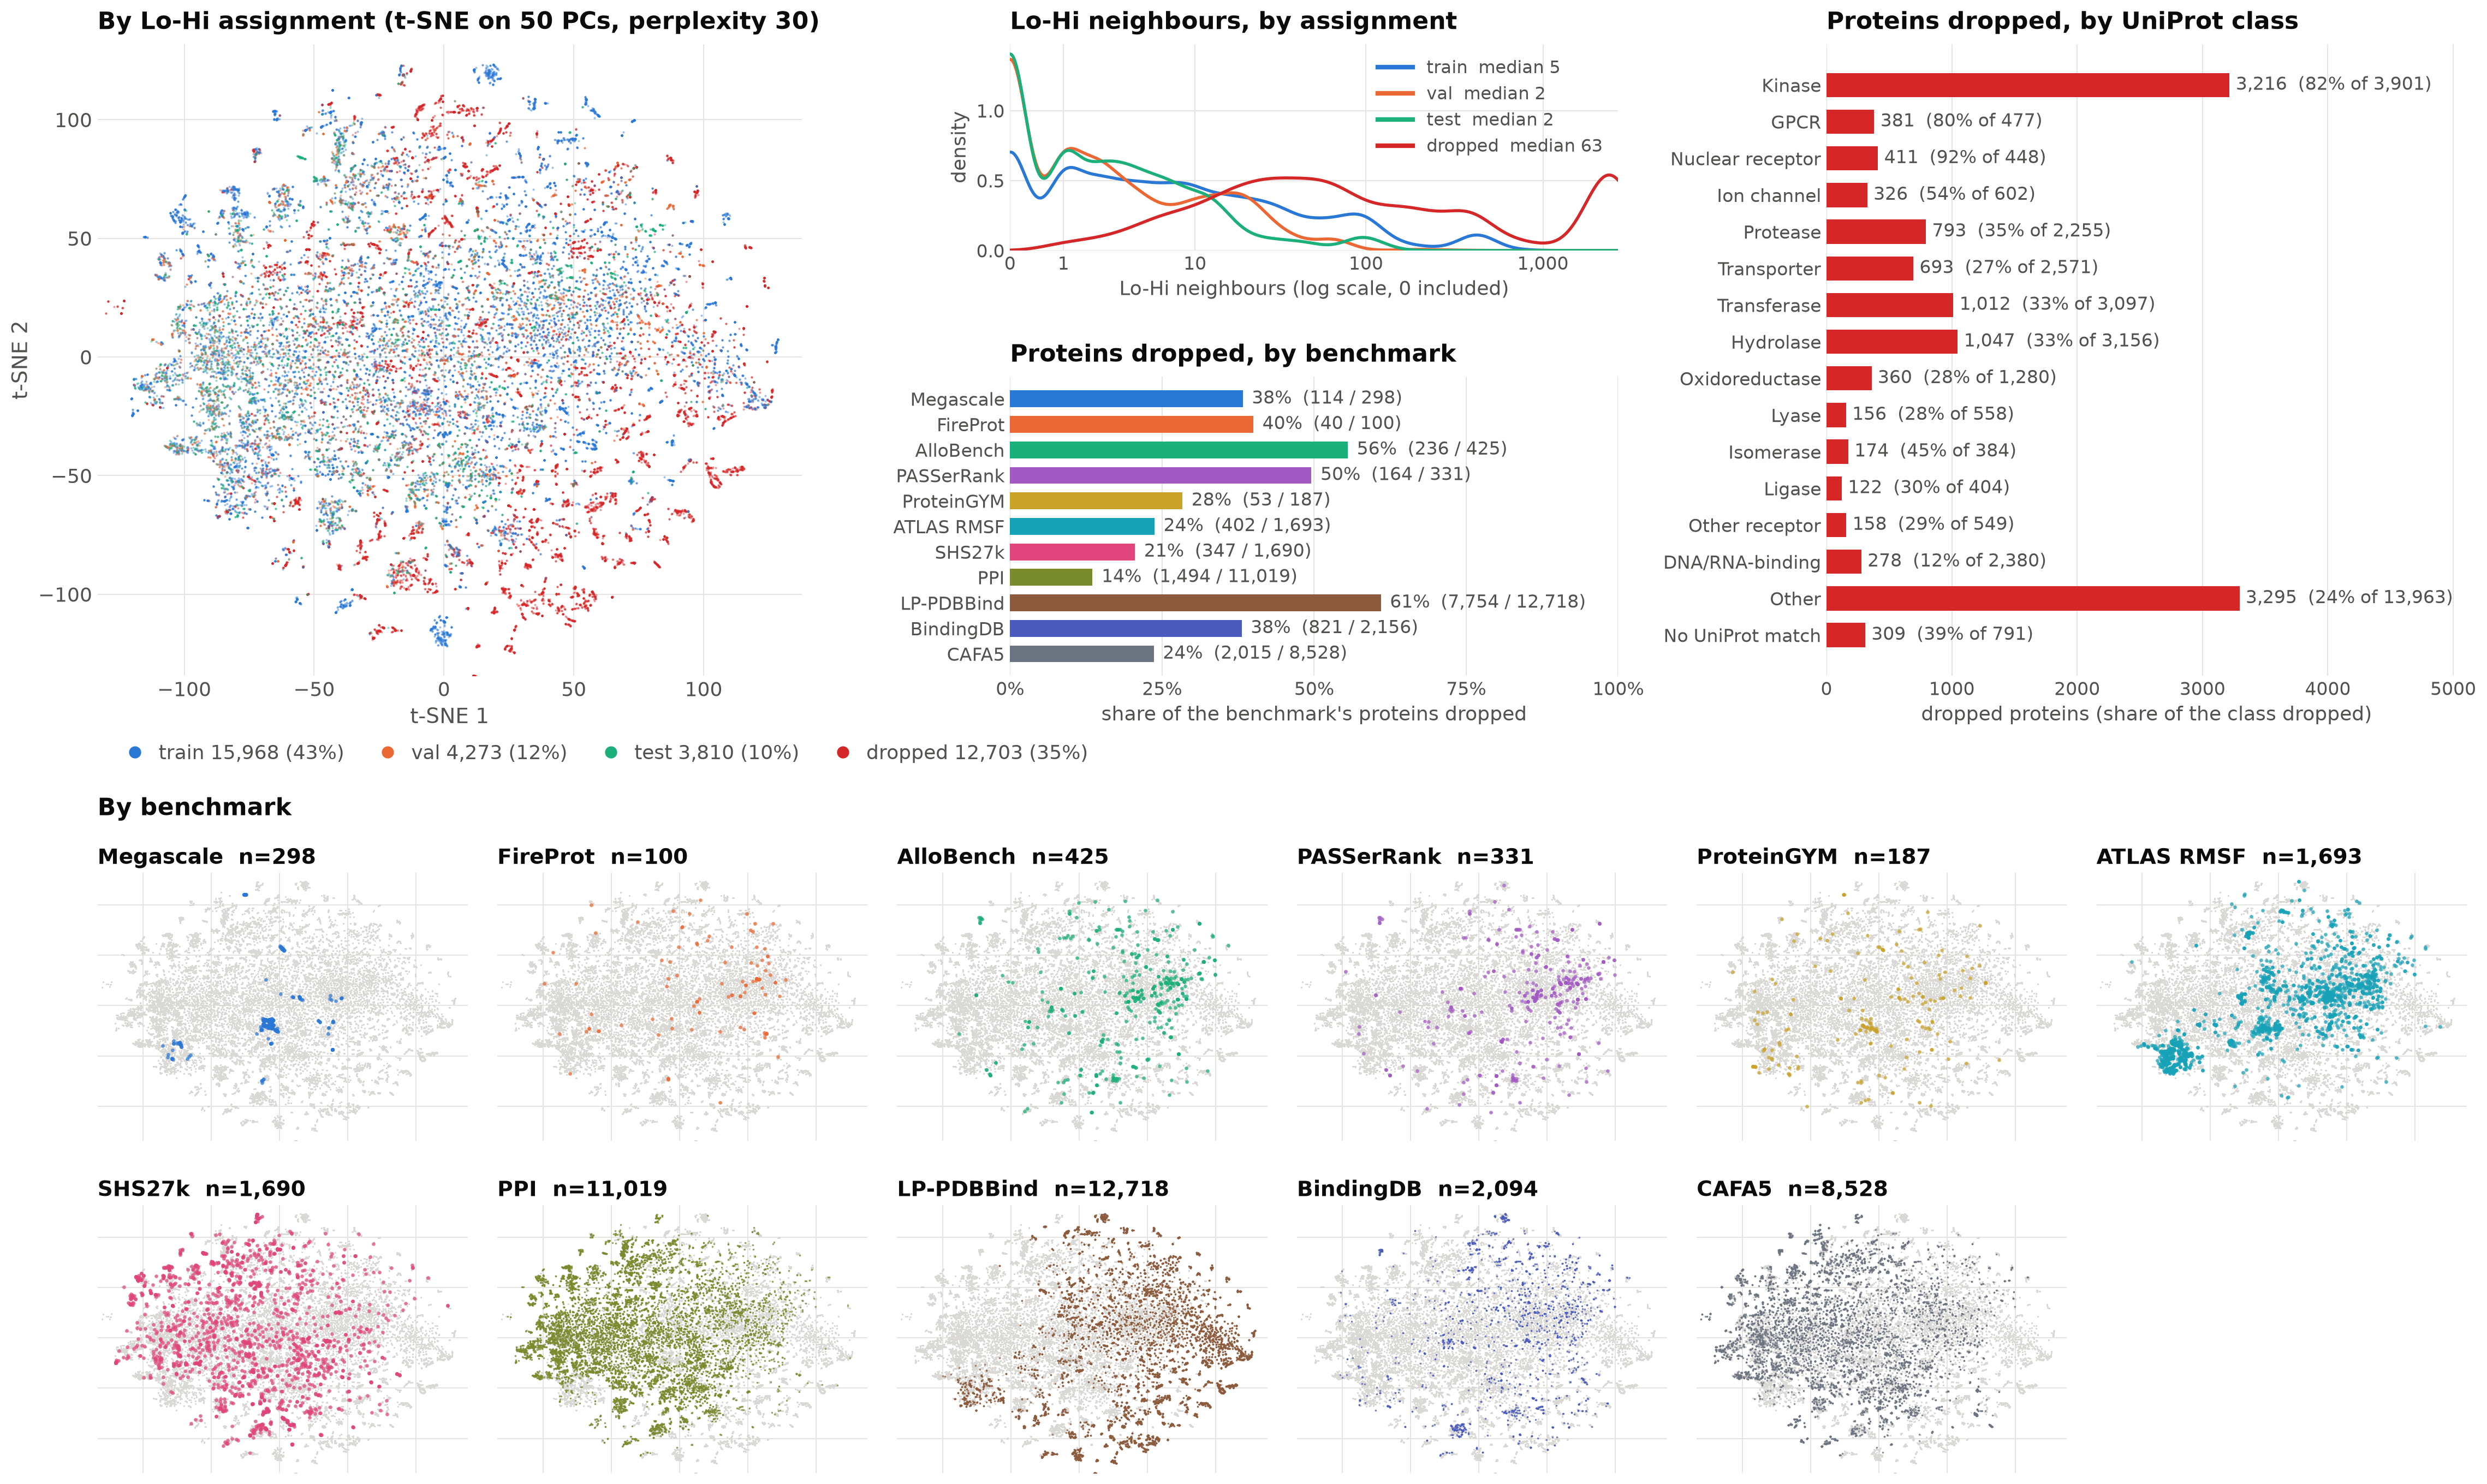
Figure S4. t-SNE analysis of proteins in each benchmark and which split they land in for the Lo-Hi method. The method drops a large fraction of kinases from clusters in LP-PDBBind and BindingDB. These make up a significant portion of proteins in the datasets, likely from vast therapeutic campaigns.
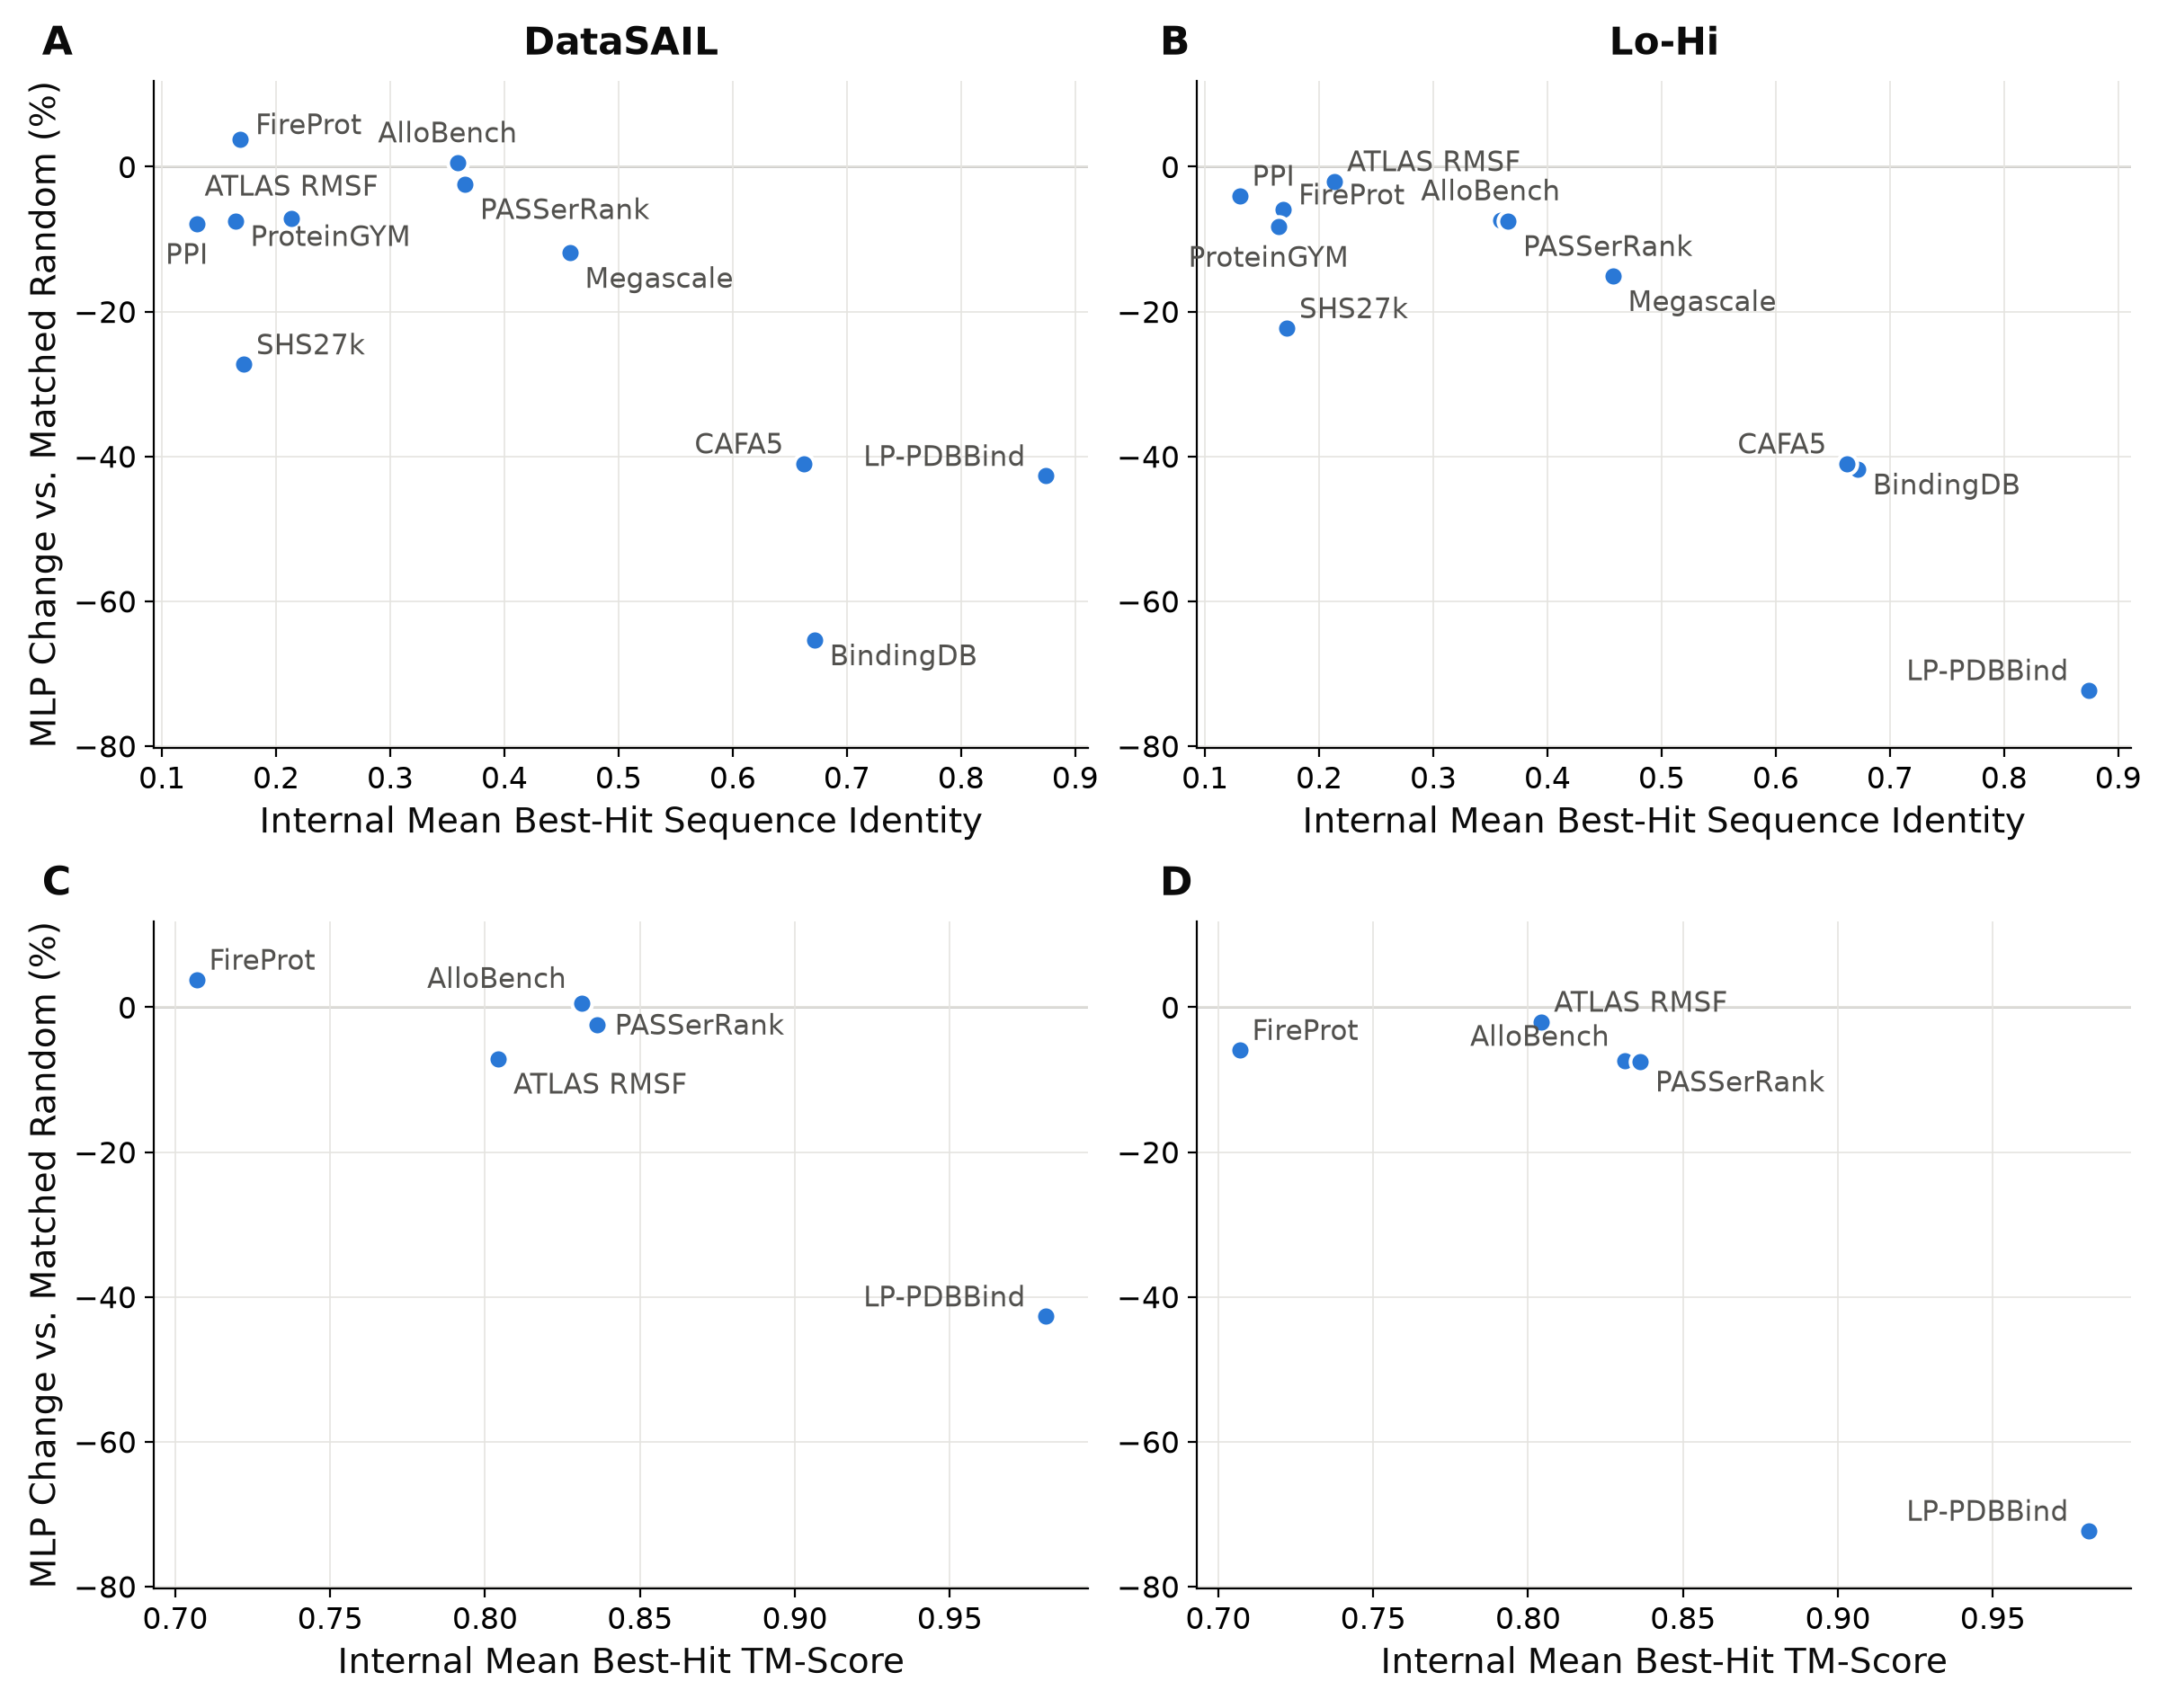
Figure S5. Change in performance due to homology control vs dataset diversity for each functional dataset.
(A) Decrease in performance on the DataSAIL splits vs internal mean best-hit sequence ID (=-0.59)
(B) Decrease in performance on the Lo-Hi splits vs internal mean best-hit sequence ID (=-0.74)
(C) Decrease in performance on the DataSAIL splits vs internal mean best-hit TM-score (=-0.70)
(D) Decrease in performance on the Lo-Hi splits vs internal mean best-hit TM-score (=-0.90)
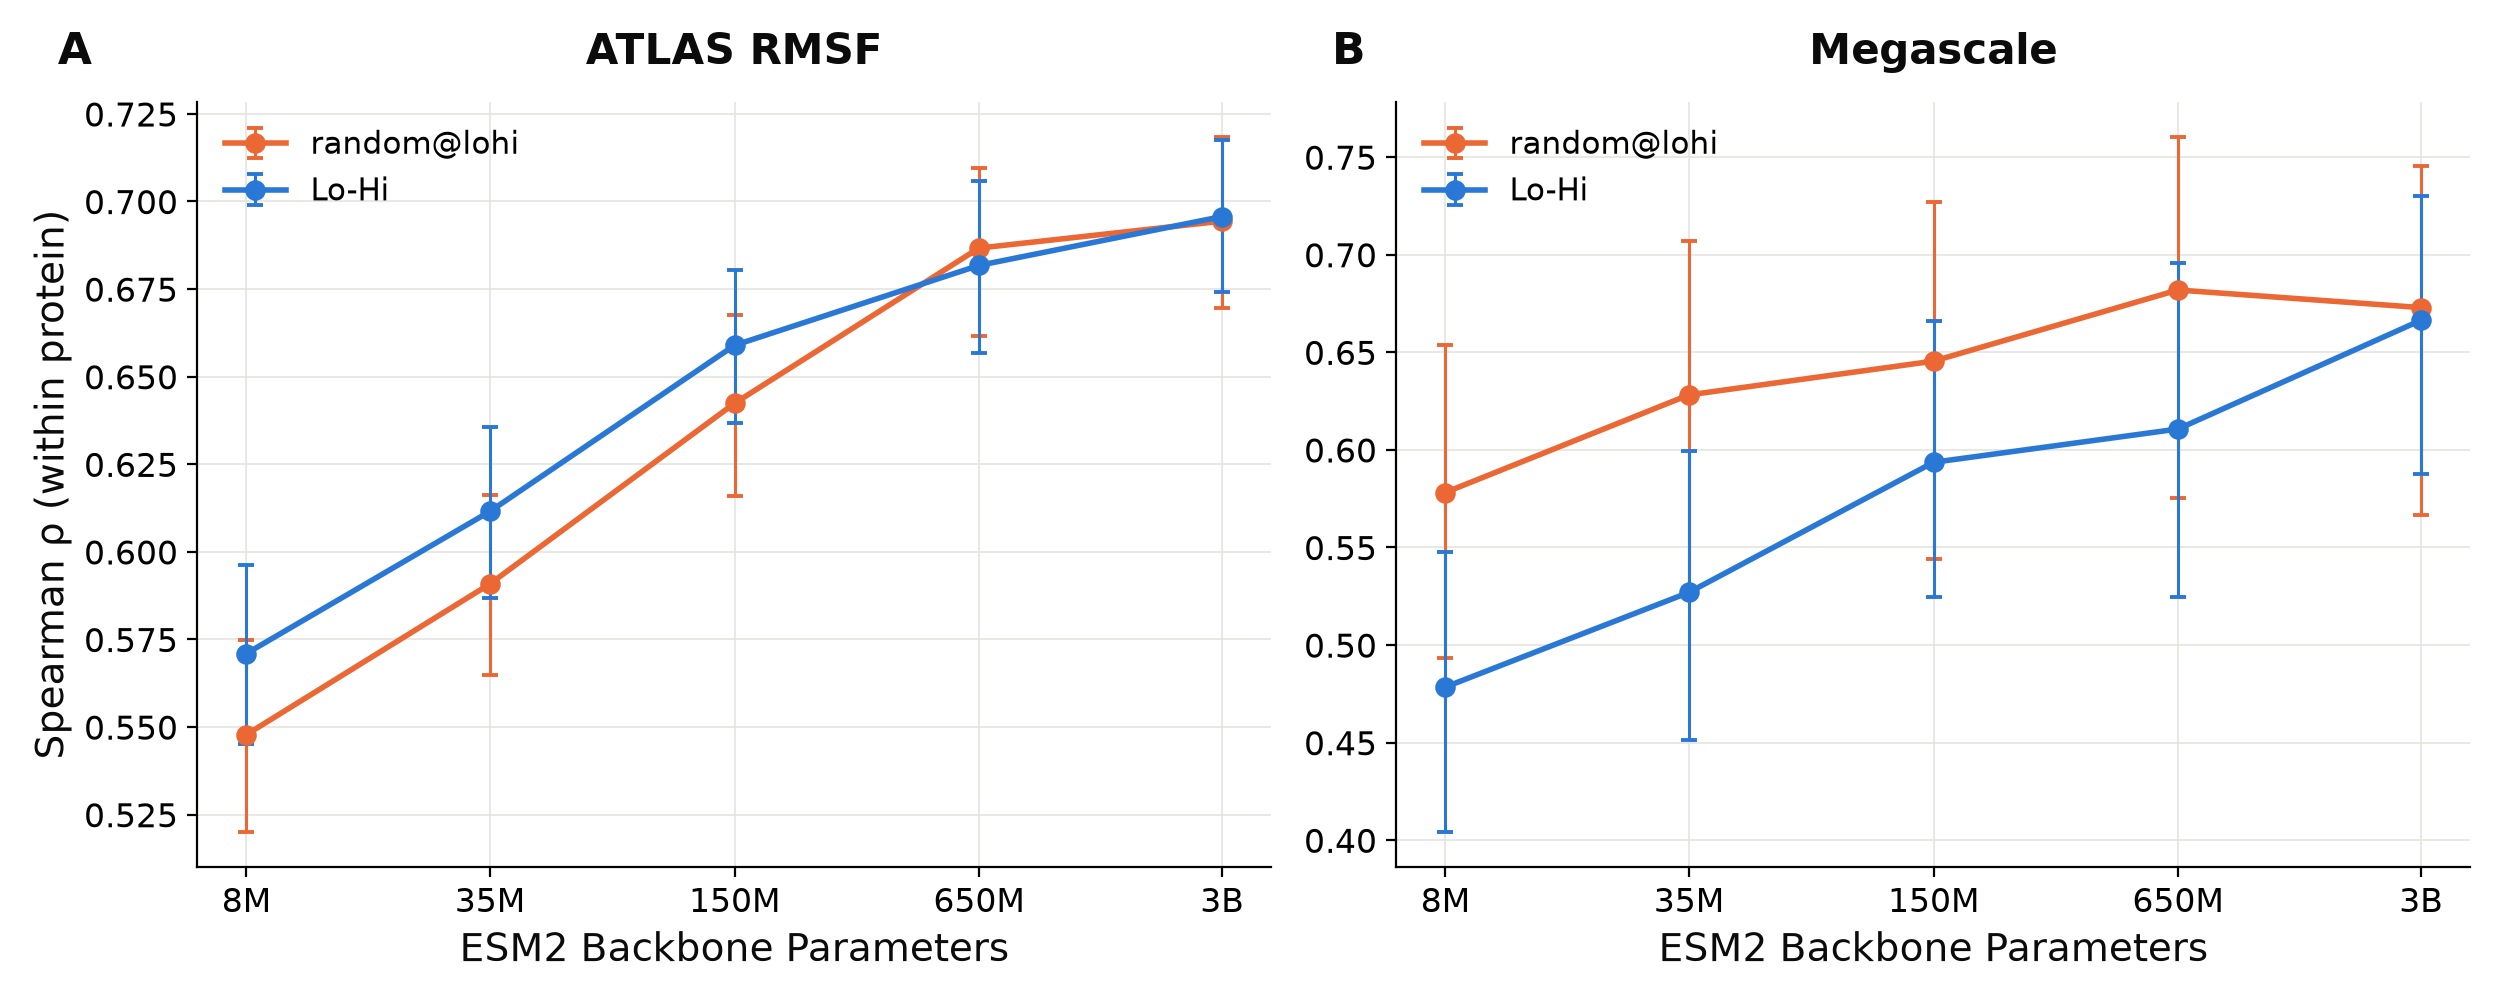
Figure S6. Scaling remains intact with homology aware splits. Linear probe predictions on ATLAS and Megascale using 5 different sizes of ESM2 show that the improvement from model size alone is not significantly different between using random and homology-aware Lo-Hi splits.
Be the first to comment on this publication.